
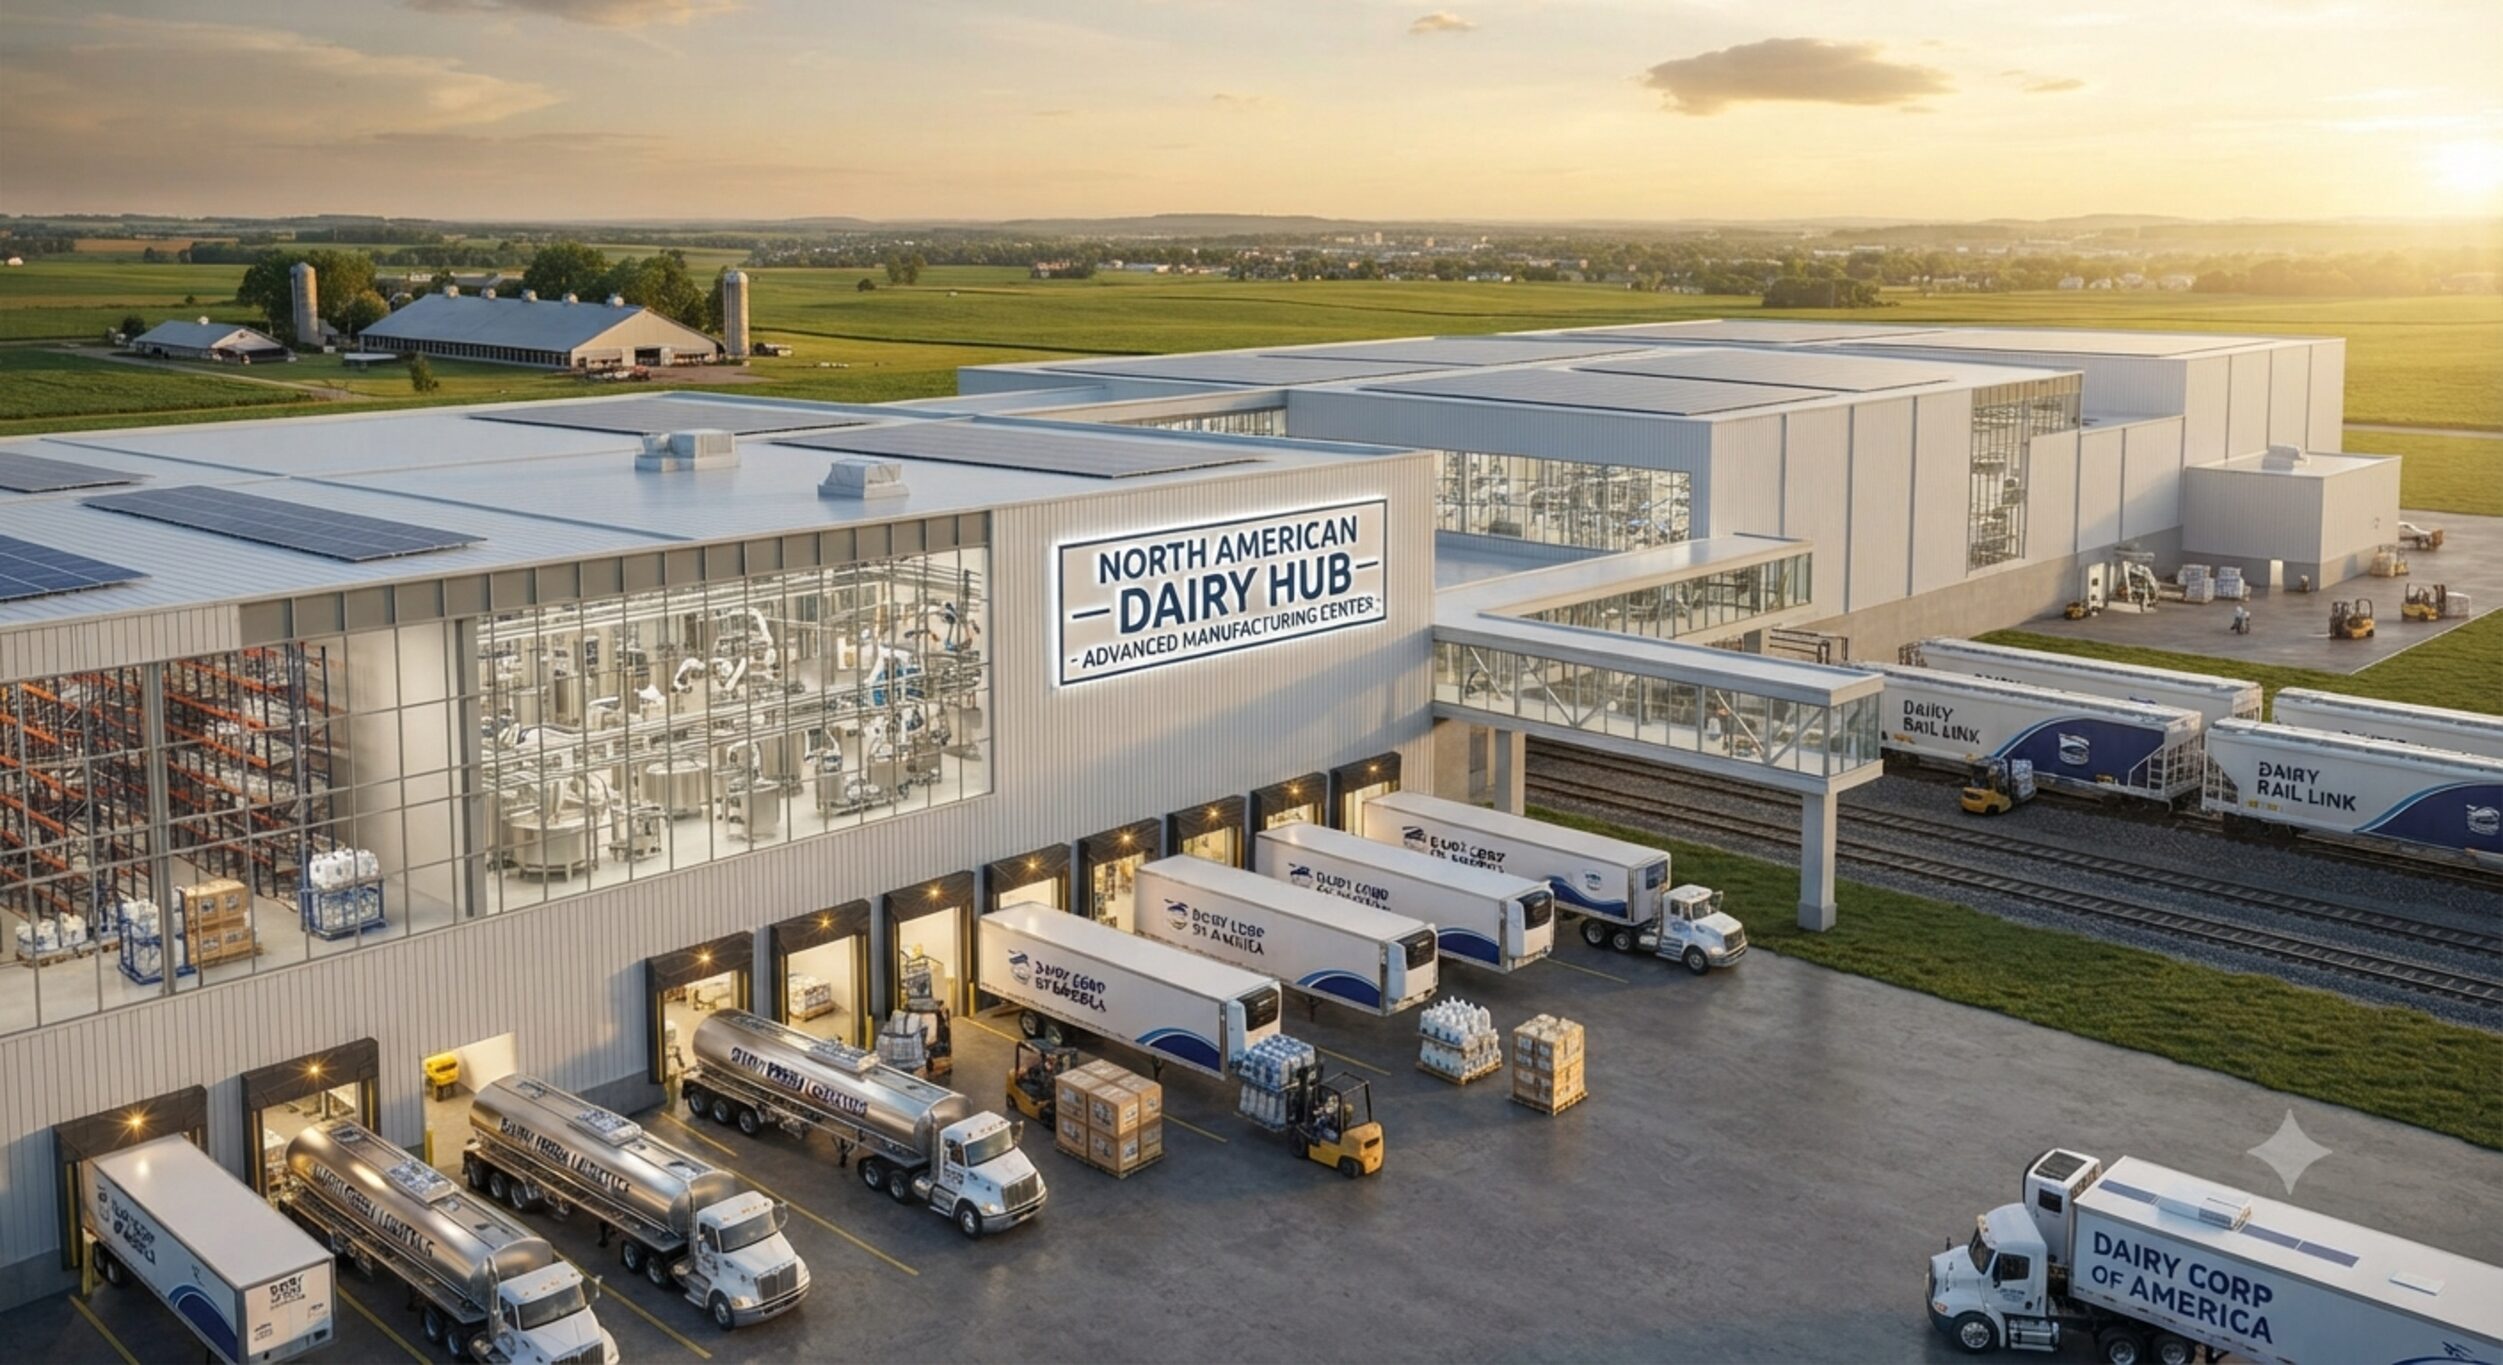

American dairy manufacturers are pouring $11 billion into new and expanded production facilities across 19 states, driven by surging export demand, record per-capita consumption, and a structural shift in what consumers want—signaling a historic opportunity for procurement teams and supply chain operators.
Dairy Manufacturing Expansion Hits Historic Scale: The $11 Billion Reality
Dairy manufacturing expansion has reached an inflection point. The International Dairy Foods Association (IDFA) released data showing U.S. dairy processors investing $11 billion in new and expanded manufacturing capacity across 19 states. That’s not gradual optimization. That’s transformational capital redeployment.
The scale reflects confidence that dairy manufacturing expansion isn’t cyclical. It’s structural. Milk production is forecast to grow by 15 billion pounds annually by 2030—enough milk to fill more than 1.7 billion gallon jugs. Simultaneously, exports to South and Central America, Southeast Asia, and the Middle East are accelerating, driven by growing consumer incomes and demand for safe, reliable dairy nutrition.
For procurement professionals, supply chain operators, and retail/foodservice buyers, dairy manufacturing expansion signals multi-year supply tightness, capital cost pressures, and changing regional sourcing dynamics.
Three Demand Drivers Fueling Dairy Manufacturing Expansion
Dairy manufacturing expansion isn’t driven by a single trend. Three distinct market forces converge:
1. Export Growth U.S. dairy exports are climbing as emerging markets develop purchasing power. South and Central America, Southeast Asia, and the Middle East represent the fastest-growing dairy demand regions globally. American producers, with scale and food safety credentials, are positioned to capture that growth. Dairy manufacturing expansion directly funds the production capacity needed to serve those markets without cannibalizing domestic supply.
2. High-Protein and Wellness Positioning Consumer demand for high-protein, wholesome foods has triggered category surge across dairy. Cottage cheese sales surged 20% in the year leading up to June 2025—a remarkable spike for a category that seemed commodity-trapped for decades. Yogurt, protein shakes, smoothies, and whey protein powder are all outpacing broader food growth. Dairy manufacturing expansion funds new production lines, specialized packaging, and processing technology for these higher-margin, faster-growing sub-categories.
3. Record Per-Capita Consumption Per-capita dairy consumption in the U.S. reached 661 pounds per person in 2023—a record. Cheese consumption has doubled in 50 years. Fluid milk consumption is growing for the first time since 2009. This isn’t decline followed by stabilization. It’s structural growth. Dairy manufacturing expansion directly funds the capacity to meet sustained domestic demand increases without supply constraints.
Together, these three drivers explain why dairy manufacturing expansion is happening now, at this scale, with this commitment.
Dairy Manufacturing Expansion by State: Investment Geography
Dairy manufacturing expansion is geographically concentrated but nationally distributed:
Top five states by investment:
- New York: $2.8 billion
- Texas: $1.5 billion
- Wisconsin: $1.1 billion
- Idaho: $720 million
- Iowa: $701 million
These five states account for approximately $6.7 billion of the $11 billion total—roughly 61% of national dairy manufacturing expansion investment.
Why this geography? Wisconsin and Idaho are traditional dairy production hubs with established supplier networks and processing infrastructure. New York and Texas represent both strong local production and gateway positions for export distribution. Iowa bridges Midwest production and Midwest processing capacity.
For procurement teams evaluating dairy sourcing, dairy manufacturing expansion concentration in these states signals: (1) supply availability will increase fastest in these regions; (2) regional pricing power will shift toward these processors as new capacity comes online; (3) non-hub states will face relative supply tightness as investment flows to major markets.
Dairy Manufacturing Expansion by Product Category: What’s Being Built
Dairy manufacturing expansion isn’t uniform across product types:
By investment volume:
- Cheese: $3.2 billion (29% of total)
- Milk/Cream: $2.9 billion (26%)
- Yogurt and Cultured Dairy: $2.8 billion (25%)
- Butter and Powders: $1.6 billion (15%)
- Ice Cream: $530 million (5%)
Cheese dominates dairy manufacturing expansion investment, reflecting decades of per-capita consumption growth and export demand. Milk and cream capacity aligns with base commodity demand. Yogurt and cultured dairy investment reflects category momentum and premiumization. Butter and powders capture exports and specialty food applications. Ice cream, despite seasonal dynamics, still attracts half a billion in new capacity.
For buyers and operators, this product-level breakdown signals where supply will ease (cheese, broadly) and where constraints may persist (specialty cultured dairy, butter products).
Real Example: Bel Group’s Babybel Expansion in Brookings, South Dakota
Bel Group’s Babybel production facility in Brookings, S.D., exemplifies dairy manufacturing expansion strategy. The facility is doubling annual production capacity from 10,000 to 20,000 tons—a 100% capacity increase at a single site.
Babybel is a globally distributed, individually packaged cheese product designed for convenience, portability, and school/lunch consumption. It’s a direct beneficiary of (1) higher per-capita cheese consumption, (2) export growth (Babybel is sold in 100+ countries), and (3) consumer premiumization toward branded, convenient dairy formats.
The Brookings facility expansion is capital-intensive—new production lines, refrigeration, packaging automation, and logistics infrastructure. But the ROI justification is straightforward: global demand for convenient, branded cheese products is growing faster than existing capacity can support. Bel Group’s $11 billion context (representing Bel’s contribution within the broader IDFA data) is a single-company signal of industry-wide capital redeployment.
For supply chain professionals, the Babybel example illustrates that dairy manufacturing expansion isn’t replacing old facilities. It’s adding new production capacity to meet genuine, verified demand growth.
What Dairy Manufacturing Expansion Means for Procurement and Supply Chain
Dairy manufacturing expansion carries concrete implications for buyers, operators, and procurement teams:
Short-term (2026–2027):
- Dairy manufacturing expansion projects create near-term capital costs. Processors may seek volume commitments or price certainty to fund facility buildout. Long-term contracts become more valuable as leverage shifts.
- Regional sourcing dynamics shift. Facilities in New York and Wisconsin will see supply increases; non-hub regions may face relative tightness.
- Specialty categories (cultured dairy, high-protein, whey powders) will see the fastest supply growth and potential margin pressure as new capacity comes online.
Medium-term (2027–2030):
- Dairy manufacturing expansion completion overlaps with 15 billion pounds of new milk production. Commodity pricing pressure increases as supply exceeds demand visibility.
- Export growth accelerates, pulling domestic supply into international channels. Retail and foodservice buyers may face regional supply constraints even as global supply expands.
- Premium and branded categories (Babybel, specialty yogurts, functional dairy) will see competitive intensity increase as multiple processors add capacity.
Long-term (2030+):
- Dairy manufacturing expansion creates structural supply oversupply risk if demand growth underperforms forecasts. Capacity utilization becomes a critical monitoring metric.
- Consolidation risk emerges: smaller processors unable to compete with newly expanded capacity holders may become acquisition targets.
- Regional sourcing leverage shifts permanently toward hub states (New York, Wisconsin, Idaho).
Cottage Cheese and Whey Protein: The Fastest-Growing Signals
Two categories deserve specific attention as signals of dairy manufacturing expansion strategy:
Cottage Cheese: A 20% sales surge in the year to June 2025 is extraordinary for a mature category. This growth reflects consumer awareness of high-protein, macro-friendly dairy options. Cottage cheese is capital-efficient to produce (less processing than cheese, faster production cycle than yogurt), and it commands premium margins. New dairy manufacturing expansion frequently includes cottage cheese lines because ROI is fast.
Whey Protein Powder: Often overlooked in dairy discussions, whey protein powders are a high-margin, export-friendly product category with minimal spoilage risk. Dairy manufacturing expansion into whey powders captures (1) domestic fitness/supplement demand, (2) export opportunities (sports nutrition is global), and (3) ingredient sales to food and beverage manufacturers. Whey powder investments are subtle within IDFA data but represent significant strategic expansion.
For procurement teams sourcing cottage cheese or whey protein powders, dairy manufacturing expansion signals: (1) supply will improve dramatically over 2026–2028; (2) price competition will intensify; (3) smaller producers will consolidate or exit these categories.
Related
Frequently Asked Questions
Will all $11 billion in dairy manufacturing expansion actually get built?
Likely yes, with timing variation. IDFA data reflects committed or announced projects, not speculative proposals. Bel Group’s Brookings expansion and similar major projects are already under construction. However, some projects may face delays (permitting, labor availability, supply chain disruptions for equipment). Plan for 80–90% completion by 2028 and full deployment by 2030. Use dairy manufacturing expansion announcements as guidance, not certainty.
If dairy manufacturing expansion adds so much capacity, shouldn’t I expect lower prices?
Not necessarily, and here’s why: (1) Dairy manufacturing expansion is funding new product categories (cottage cheese, high-protein, whey powders), not just commodity milk. These categories command premium pricing. (2) Export demand is growing simultaneously with supply expansion, so increased production gets pulled into international channels. (3) Some regions will see supply increases; others will face relative tightness. Geographic arbitrage may persist. Monitor regional pricing rather than assuming national price decline.
Which dairy categories will see the biggest price pressure from dairy manufacturing expansion?
Cheese and milk/cream ($3.2B and $2.9B respectively) represent 55% of dairy manufacturing expansion. These are commodity-adjacent categories with lower margins. Specialty categories (cottage cheese, cultured dairy, whey powders) are expanding from smaller bases with higher margins, so per-unit growth is steeper but pricing power remains. If you source cheese or fluid milk, monitor closely for competitive pricing as new capacity comes online in 2027–2028. If you source specialty dairy, expect supply to ease faster than pricing.
Should we lock in long-term dairy contracts now before prices change?
It depends on your product mix and regional sourcing. If you source commodity cheese or milk from non-hub states, yes—securing volume and pricing before dairy manufacturing expansion drives regional competition makes sense. If you source specialty dairy (yogurt, cultured, whey products) or cheese from hub states (Wisconsin, New York), the calculus is different. You’ll have multiple suppliers competing for volume. Short-term or rolling contracts may offer better terms as new capacity ramps and competes for customers.
Sources
| Source | URL | Details |
|---|---|---|
| International Dairy Foods Association (IDFA) | https://www.idfa.org | $11 billion dairy manufacturing expansion; 19-state investment data; product category breakdown; state-by-state totals |
| Dairy Foods Magazine | https://www.dairyfoods.com | Brian Berk, Editor-in-Chief; July 21, 2026; Bel Group Babybel Brookings facility expansion coverage |
| Bel Group | https://www.belgroup.com | Babybel production facility expansion; 10,000 to 20,000 ton capacity increase; Brookings, S.D. location |
| Circana | https://www.circana.com | Cottage cheese sales data; 20% surge year-over-year to June 2025; retail tracking and insights |
| IDFA Dairy Consumption Data | https://www.idfa.org | Per-capita dairy consumption 661 lbs/person (2023); cheese consumption trends; fluid milk consumption growth since 2009 |
| U.S. Dairy Export Council | https://www.usdec.org | Export market data; South and Central America, Southeast Asia, Middle East demand drivers |