
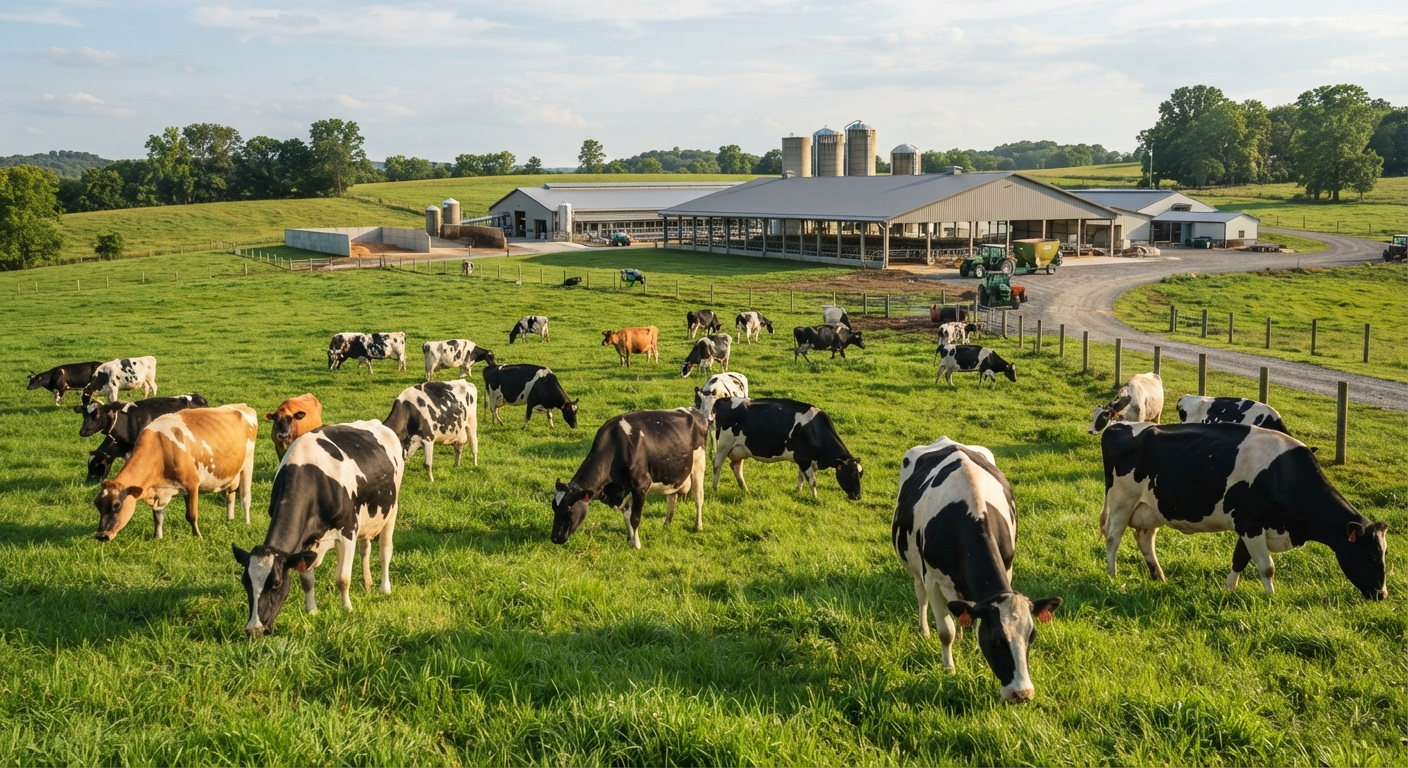

A decade of butterfat-focused production is now forcing the industry to completely reverse strategy as protein-to-fat ratios collapse below competitive standards.
How America’s Butterfat Obsession Created a Global Dairy Competitiveness Crisis
The U.S. dairy industry is confronting an uncomfortable truth: a decade-long focus on maximizing butterfat production has inadvertently created a structural competitiveness problem that now requires massive, sustained genetic and management adjustments to overcome. CoBank’s latest analysis reveals that while butterfat levels in American milk have skyrocketed over the past ten years, gains in protein content have lagged dramatically—and this imbalance is now compromising the quality of domestic cheese production and threatening U.S. export market share against global competitors.
The numbers tell the story. Butterfat gains have more than doubled protein growth over the past decade, driven by market incentives targeting underserved domestic butterfat markets. U.S. dairy farmers successfully met that challenge. Butter production is now historically high, and exports are setting records. But this success created an unintended consequence: the protein-to-fat ratio in American milk collapsed from 0.83 to 0.77 over the same decade—a decline that has compromised cheesemaking efficiency and forced processors to spend millions on added milk protein solids just to meet basic production requirements.
The competitive reality is stark. The European Union and New Zealand—America’s primary competitors in global dairy export markets—have maintained far more stable protein-to-fat ratios (EU steady at 0.83-0.84, New Zealand steady at 0.77) while simultaneously outpacing the U.S. in protein production growth. For the first time in recent years, U.S. milk protein values surpassed butterfat last August—a pricing reversal that signals the industry is finally correcting course. But catching up to global competitors will take years of sustained effort and will require structural changes in dairy genetics, farm management, and pricing incentives.
The Butterfat Boom: How Market Incentives Created an Imbalanced Supply
Understanding how the U.S. dairy industry ended up with disproportionate butterfat relative to protein requires examining the economic incentives that shaped production decisions over the past decade. Corey Geiger, lead dairy economist with CoBank, explains: “Butterfat gains have been driven largely by demand to fill underserved domestic butterfat markets.” U.S. dairy farms responded rationally to these market signals, optimizing for butterfat production through feed management, breeding strategies, and herd composition decisions.
The strategy worked spectacularly—perhaps too well. American dairy farmers succeeded in meeting the butterfat demand challenge, transforming the U.S. from a potential butterfat-deficit region into a butterfat-surplus producer with historically high butter exports. This achievement validated the economic logic behind the decade-long focus on butterfat production.
But solving one market problem created another. The same decade that delivered historically high butterfat production simultaneously starved the industry of the genetic and management tools necessary to match protein production growth. Unlike butterfat, which can be influenced through nutrition and lactation stage management, protein production relies almost entirely on animal genetics—a factor that responds far more slowly to market incentives and requires sustained, multi-generational breeding strategies.
The result: a structural imbalance where U.S. dairy farmers created abundant butterfat while falling behind global competitors in protein production growth, the very component now driving the highest-value dairy products (yogurt, ultra-filtered milk, protein-enriched beverages) and ingredient demand globally.
The Cheesemaker Crisis: How Butterfat Abundance Created Production Inefficiency
The most immediate and visible consequence of the butterfat boom has been disruption to American cheesemaking. Cheese production formulas vary by variety, but an optimal protein-to-fat ratio above 0.80 is the industry standard for balanced cheese quality and production yields. When the U.S. protein-to-fat ratio declined from 0.83 to 0.77, cheesemakers suddenly found themselves working with milk that no longer met their optimal production requirements.
The response has been costly and operationally inefficient. Nearly all U.S. cheesemakers have adopted the practice of adding milk protein solids during production—a workaround that compensates for inadequate natural protein levels in raw milk but introduces process complexity and additional cost. For cheesemakers operating on thin margins, this represents a material increase in production costs that must be absorbed either through higher milk procurement costs or lower profit margins.
The magnitude of this challenge becomes clear when comparing U.S. cheesemakers to their global competitors. New Zealand and EU cheesemakers have maintained protein-to-fat ratios far closer to optimal standards. New Zealand’s ratio varied only slightly, beginning and ending the 2015-2025 period at 0.77. The EU maintained even tighter discipline, holding its ratio between 0.83 and 0.84 throughout the entire decade. These competitors simply did not face the operational friction and cost complications that American cheesemakers now manage daily.
Export Market Implications: Why Global Competitiveness Depends on Balanced Milk Components
The protein-to-fat imbalance carries profound implications for U.S. dairy export markets. The European Union, New Zealand, and the United States collectively account for two-thirds of global dairy exports—meaning competition between these three regions fundamentally shapes global dairy trade patterns. However, both the EU and New Zealand have increased protein at a faster pace than butterfat over the past decade, more closely matching global trends in dairy product and ingredient demand.
This divergence reflects a fundamental shift in what global dairy markets actually want. While domestic U.S. markets absorbed abundant butterfat into expanding butter, cheese, and cream channels, global markets increasingly prioritized protein-concentrated products: yogurt, cheese made from protein-enriched milk, whey proteins, and milk powder ingredients for protein beverages. By focusing single-mindedly on butterfat production, U.S. dairy farmers inadvertently produced a supply profile that no longer aligns with the highest-value global markets.
For export-oriented dairy processors like Chobani and fairlife—the companies now making $13 billion in capacity investments—access to milk with balanced butterfat-protein ratios is essential. Ultra-filtered milk products demand high protein content. Yogurt production requires specific protein-to-fat balances for texture and nutritional positioning. Processors importing protein-enriched milk from outside the U.S. or paying premiums for rare domestic high-protein supplies will gain cost advantages over competitors relying on current average U.S. milk composition. This creates a potential shift in U.S. export competitiveness if the industry cannot restore protein-to-fat balance rapidly.
U.S. Protein Growth: Accelerating But Still Trailing Competitors
Despite the butterfat boom constraining overall protein progress, the U.S. dairy industry has made meaningful strides in protein production growth in recent years. From 2015 to 2025, American dairy farmers improved protein production by 7.4%—a solid accomplishment. More tellingly, two-thirds of those gains occurred in the last five years, demonstrating accelerating momentum as economic incentives shifted toward protein pricing premiums.
Comparative growth rates reveal the U.S. trajectory is now faster than competitors, but starting from a lower baseline. New Zealand achieved 2.1% protein growth in the first half of the decade (2015-2020) and 1.7% in the second half (2020-2025)—slower than the current U.S. pace but from a higher protein-content baseline. The EU saw 1.5% protein growth in the second half of the decade—even slower—but again from a higher starting point maintaining the 0.83-0.84 protein-to-fat ratio that American cheesemakers now struggle to achieve.
The critical insight: U.S. dairy farmers are accelerating protein production, but they’re playing catch-up from a deficit position. Current growth rates, while faster than competitors’, are insufficient to restore the 0.83 protein-to-fat ratio that characterized U.S. milk composition a decade ago within any reasonable timeframe.
The Genetic Challenge: Why Protein Gains Take Years, Not Months
The primary constraint on faster protein production growth is biological, not economic. Butterfat can be influenced through lactation management, nutrition, and seasonal factors. Protein production relies almost entirely on animal genetics—herd composition, dairy breed selection, individual cow genetic merit—factors that respond slowly to market incentives and require sustained multi-generational breeding strategies.
Abbi Groves, agricultural commodities economist with CoBank, emphasizes this reality: “Fully restoring the protein-to-fat ratio of 0.83 from a decade ago will require years of sustained higher protein growth.” Dairy breed associations are now implementing genetic selection initiatives prioritizing protein production, and component-based milk pricing formulas have shifted premiums to reward high-protein milk. But these initiatives will take years to move through the breeding pipeline and show measurable results across the national herd.
Market and Economics: How Pricing Incentives Are Driving the Protein Reversal
The shift from butterfat to protein prioritization didn’t occur through industry exhortation or goodwill. It occurred because market fundamentals changed. Butterfat and protein values reversed in August 2025 when protein values surpassed butterfat for the first time in recent years. This pricing change reflects global demand realities: protein-intensive dairy products (yogurt, ultra-filtered milk, protein ingredients) are driving the highest margins for processors, who now willingly pay premiums for milk with elevated protein content.
For dairy farmers, this pricing reversal creates immediate economic incentive to adjust herd genetics and feed management toward protein maximization. Cooperatives and milk processors are restructuring component-based payment formulas to reward high-protein milk with premium pricing. These economic signals will gradually reshape herd composition as farmers replace butterfat-optimized genetics with protein-focused breeding stock.
However, Abbi Groves cautions that progress will remain slow: “Until protein production gains catch up to butterfat, the U.S. will need to find more domestic and international outlets for its growing butterfat supply.” This suggests a multi-year period where the industry simultaneously accelerates protein production while managing abundant butterfat supplies—a reality that will require continued investment in butter production and export channels even as the industry redirects breeding and herd management efforts toward protein.
What This Means for U.S. Dairy Farmers, Processors, and Export Competitiveness
The protein-to-fat rebalancing underway in U.S. dairy has profound implications for multiple industry participants:
For Dairy Farmers: Genetic and management decisions made now will affect herd protein content for years. Farmers who shift toward protein-optimized genetics and management practices early will capture premium pricing as high-protein milk becomes more valuable. Those who delay adaptation face the risk of managing herds producing below-premium milk composition.
For Cheesemakers: Restoration of the 0.83 protein-to-fat ratio would eventually eliminate the need for added milk protein solids, reducing production costs and improving competitiveness against EU and New Zealand cheese producers. Near-term, expect continued reliance on protein additions but declining costs as domestic milk protein content gradually improves.
For Export-Oriented Processors: Chobani, fairlife, and other processors making billion-dollar capacity investments are betting on protein-enriched milk becoming standard U.S. supply. The faster protein-to-fat ratios restore, the more efficiently these processors can operate newly built facilities without importing protein or paying premiums for rare domestic high-protein milk.
For Global Competitiveness: The U.S. cannot close the protein competitiveness gap overnight. Years of sustained higher protein growth will be required. During this transition, EU and New Zealand competitors maintain advantage in protein-concentrated export markets. U.S. export share in premium protein categories may decline before improving.
FAQ: Your Questions About U.S. Dairy Protein-to-Fat Ratios and Industry Rebalancing
Q: Why has U.S. milk butterfat grown faster than protein over the past decade? A: Market incentives drove focus on butterfat production to fill underserved domestic butterfat markets. U.S. dairy farmers responded by optimizing feed management, breeding, and herd composition for butterfat maximization. The strategy succeeded—U.S. butter production and exports are now historically high.
Q: What is the optimal protein-to-fat ratio for cheese production? A: Cheese production formulas vary by variety, but a protein-to-fat ratio above 0.80 is generally preferred for optimal cheese quality and production yields. The ideal ratio for most cheddar and American-style cheeses is closer to 0.83.
Q: How much has the U.S. protein-to-fat ratio declined over the past decade? A: The U.S. protein-to-fat ratio declined from 0.83 to 0.77 over the past decade—a 7.2% drop that has forced American cheesemakers to add milk protein solids during production to compensate for inadequate natural protein content in raw milk.
Q: How do U.S. protein-to-fat ratios compare to global competitors? A: The EU has maintained a protein-to-fat ratio between 0.83 and 0.84 over the past decade, and New Zealand has held steady around 0.77. Both competitors have outpaced the U.S. in protein production growth while maintaining more stable protein-to-fat ratios.
Q: When did protein values surpass butterfat in milk pricing? A: Protein values surpassed butterfat for the first time in recent years in August 2025, signaling a fundamental shift in market incentives toward protein production. This pricing reversal reflects global demand for protein-intensive dairy products like yogurt and ultra-filtered milk.
Q: How much has U.S. protein production grown over the past decade? A: From 2015 to 2025, U.S. protein production improved by 7.4%. More importantly, two-thirds of these gains occurred in the last five years (2020-2025), demonstrating accelerating momentum as economic incentives shifted toward protein premiums.
Q: Why does protein production growth take longer than butterfat growth? A: Butterfat can be influenced through lactation management, nutrition, and seasonal factors. Protein production relies almost entirely on animal genetics, which respond slowly to market incentives and require sustained multi-generational breeding strategies to show measurable results.
Q: How long will it take to restore the 0.83 protein-to-fat ratio? A: According to CoBank economists, fully restoring the protein-to-fat ratio from a decade ago will require years of sustained higher protein growth. No specific timeline is provided, but the genetic constraints suggest a minimum of 5-10 years of consistent protein prioritization.
Q: What are cheesemakers doing about low protein content in U.S. milk? A: Nearly all U.S. cheesemakers have adopted the practice of adding milk protein solids during production to compensate for inadequate natural protein levels in raw milk. This workaround increases production costs and reduces efficiency compared to cheesemakers using higher-protein milk supplies.
Q: How does the protein-to-fat rebalancing affect U.S. export competitiveness? A: Global dairy markets increasingly prioritize protein-concentrated products. U.S. cheesemakers, yogurt producers, and other processors face cost disadvantages competing against EU and New Zealand counterparts until U.S. protein-to-fat ratios improve. Export share in premium protein categories may decline before improving.
Source Materials:
- CoBank Knowledge Exchange Report on U.S. Milk Component Production (August 2026)
- Corey Geiger, CoBank Lead Dairy Economist, Analysis on Butterfat and Protein Dynamics
- Abbi Groves, CoBank Agricultural Commodities Economist, Protein-to-Fat Ratio Restoration Outlook
- U.S. vs. EU vs. New Zealand Milk Composition and Protein-to-Fat Ratio Analysis (2015-2025)
- Global Dairy Export Market and Protein Demand Analysis (2026)