

Fonterra lifts its payout midpoint, China locks in EU dairy duties, and why Q4 is the first supply contraction in two years.
If you remember one thing about dairy in 2026, make it this: the world made too much milk, and almost everything else that happened this year was a reaction to it.
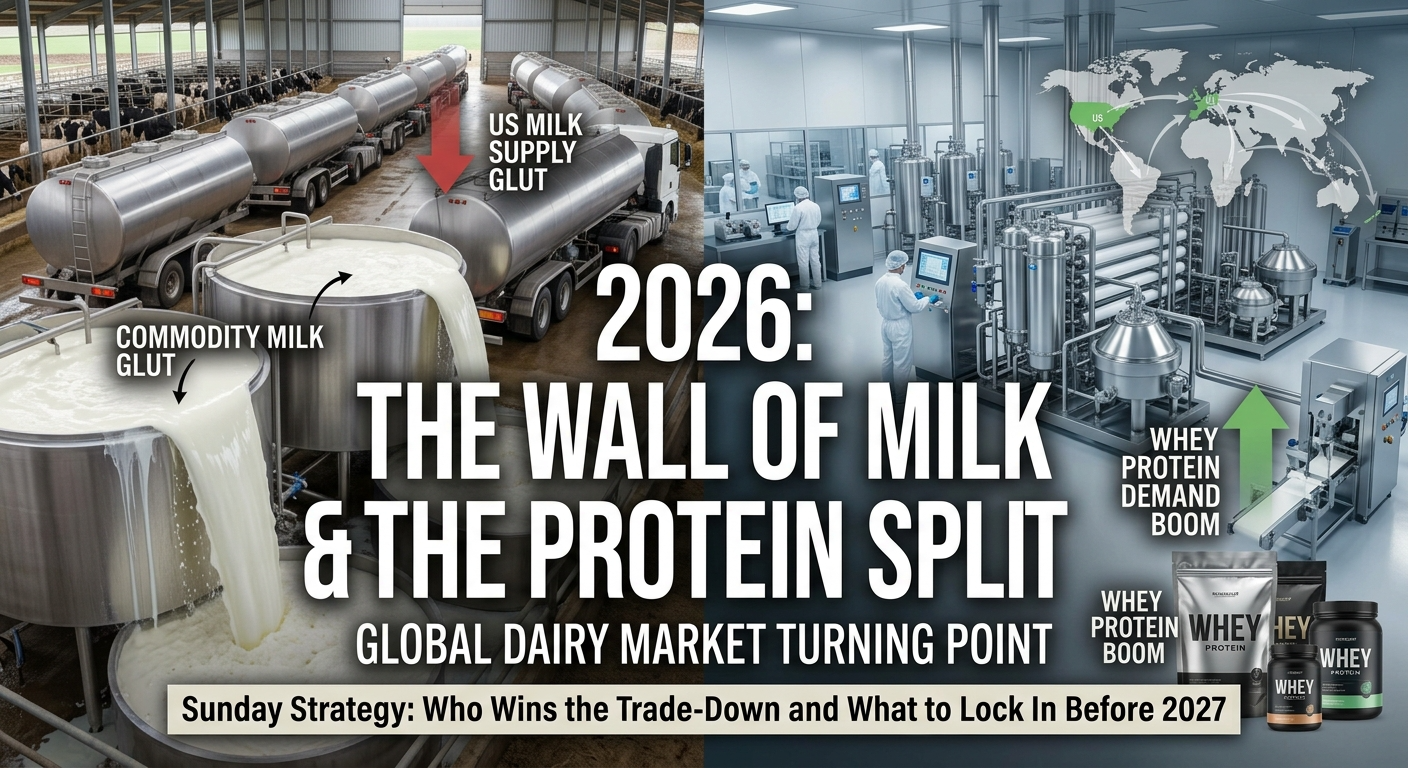
The “wall of milk” that built through the second half of 2025 crushed fat and powder prices into the first quarter, squeezed farm margins on every major exporting continent, and kicked off a fresh round of consolidation. At the same time, a protein boom driven by health trends and GLP-1 medications turned whey from a cheese-plant byproduct into the most valuable stream in the vat.
Now, nine months in, the market is turning. Supply growth is stalling, input costs are climbing, and the major analysts expect output from the big exporters to contract in Q4. For buyers, that means the cheapest milk of the cycle is probably behind us, but the bill will not rise evenly across products. Protein, fat and cheese are heading in different directions, and your contracting strategy needs to reflect that.
This Sunday Strategy edition breaks down how we got here, who is winning and losing, and what to lock in before the new year.
Your 30-second scan
- The Wall of Milk: how record 2025 output from the US, EU and New Zealand set up the 2026 glut
- The price damage: fat and whole milk powder took the biggest hits; cheese stayed heavy
- The protein split: whey prices at records, and why some cheese plants now earn more from whey than cheese
- Regional scorecard: US still growing, Europe hitting limits, New Zealand facing El Niño, China stabilising
- Trade and geopolitics: China’s final duties on EU dairy, Middle East disruption and freight costs
- Farm economics: rising feed, energy and fertiliser costs, beef-on-dairy and the consolidation wave
- The turn: why Q4 2026 marks the first contraction in Big 7 supply, and what it means for 2027
- The playbook: product-by-product buying calls and what to lock in now
1. The Wall of Milk: how the glut was built
The 2026 oversupply was not a surprise. It was built in plain sight during the second half of 2025, when every major exporter grew at once.
In October 2025, the EU and UK posted their fastest milk growth since 2017. US output rose more than 3% year on year for five months running. New Zealand set monthly milk-solids records from May to September 2025. Rabobank estimates Big 7 exporter output finished 2025 up roughly 2.2% to 2.6% (the figure was revised upward during the year), the strongest growth in years.
Three things made it happen at the same time:
- Cheap feed. A record 2025 grain harvest kept feed costs low, so farmers had every reason to push yields.
- Good weather. Mild conditions across Europe and Oceania lifted grass growth and kept cows producing into autumn.
- More solids per litre. Genetics and feeding drove fat and protein content higher, so each litre carried more product into the vat.
The momentum carried into 2026. EU milk deliveries rose about 3.7% in the first half of the year and were still running about 3.1% ahead for January to August. In the US, USDA’s September estimate puts 2026 production at 237.2 billion pounds, up 5.5 billion pounds (roughly 2.4%) on 2025. US output was still up 1.8% year on year in August.
Why this matters for you: a supply wave this broad takes time to clear. Even as farm-level output slows, processors and traders are still working through product made during the peak. That is why spot prices can stay soft for a quarter or more after the milk itself starts to tighten.
2. The price damage: fat took the hardest hit
The glut hit prices fast, and it did not hit every product equally.
The commodity crash. Between September 2025 and February 2026, milk fat markets fell around 40% and whole milk powder around 30%. The IFCN Dairy Research Network recorded its seventh straight monthly decline in global milk prices in December 2025, a slide that began in June that year.
The farmgate fallout. In the US, January Class III milk was $5.75 per hundredweight below a year earlier and Class IV was $7.18 lower. In Europe, the average farmgate price for January to August 2026 is running close to €43 per 100kg, about 19% below the same period of 2025. Eurostat put the Q2 drop at 16.6% year on year, the third straight quarterly decline. The pain was severe enough that Romania and Slovakia asked Brussels for an extraordinary EU dairy crisis plan in January.
The auction rollercoaster. The Global Dairy Trade (GDT) index opened 2026 with a sharp rally, including a 6.3% jump at the first auction of the year. That rebound faded in March and April as supply kept coming. The index did not post another increase until early May. The mid-September event slipped 1.1% to an average of about $3,868 per tonne, although cheddar jumped 16.5% at that auction. The next event is on Tuesday, 6 October.
The New Zealand barometer. Fonterra’s forecasts track the year neatly. It opened the 2026/27 season in May with a NZ$9.75/kgMS midpoint, cut to NZ$9.25 in July after reference product prices fell 11%, then lifted to NZ$9.50 on 21 September as powder prices recovered. For context, the final 2025/26 price came in at NZ$9.69, against NZ$10.16 the season before.
Why this matters for you: 2026 has been a buyer’s market for fat and commodity powders. If you did not lock in cover during Q1 and Q2, the deepest discounts are probably gone, and Q4 pricing is already firming in Europe and Oceania.
3. The protein split: whey is the new cream
While fat and commodity powders slumped, protein went the other way. That split is the second big story of 2026, and it may matter more for long-term strategy than the glut itself.
Record prices. Spot whey protein concentrate (WPC 80) has climbed from roughly $2.50 per pound in mid-2023 to around $13.50 per pound by late August 2026, according to US market analysts. In Europe, standard food-grade whey powder rose more than 50% in the first four months of the year to about €1,700 per tonne, a record. High-protein concentrates are trading around €20,000 per tonne. European whey protein prices have now overtaken US prices.
What is driving it. Consumers want convenient protein, and GLP-1 weight-loss medications have added a new group of buyers looking for nutrient-dense food. Analysts are careful not to give GLP-1s all the credit. The broader health and wellness trend, across many countries, is doing most of the work.
Why supply cannot respond quickly. Whey is made alongside cheese, so you cannot simply produce more of it. Specialised drying and filtration capacity is the bottleneck. US processors have announced around $11 billion in new and expanded plants across 19 states, but those take years to build.
The knock-on effects:
- Cheese economics have flipped. At times this year, cheese plants have earned more from their whey stream than from the cheese.
- US milk prices are getting a lift. Dry whey has held above 60 cents per pound since September 2025, and every 5-cent move in dry whey adds about 30 cents per hundredweight to the Class III price.
- Lower-value uses are being priced out. Feed applications such as calf milk replacer are losing access to whey as sports nutrition and functional food buyers outbid them.
- There is a cheese risk. Rabobank warns that plants built to chase whey also produce more cheese, which could push cheese into oversupply.
Signs of fatigue. Prices are starting to test what buyers will pay. US whey protein isolate stocks rose in May even as production fell, a sign that demand at the very top of the market is cooling. Most analysts still expect prices to stay well above historical averages through the end of 2026.
Why this matters for you: if you buy protein ingredients, you are facing a structural shortage, not a cyclical spike. If you buy cheese, the same whey boom is quietly adding capacity that could keep cheese prices soft into 2027.
4. Regional scorecard: who is still pumping, who is pulling back
The US is the only major exporter still growing strongly into Q4. Almost everyone else is slowing, and that divergence will shape trade flows into 2027.
| Region | 2026 supply | Price signal | Into 2027 |
|---|---|---|---|
| United States | Still growing: 2026 output forecast at 237.2bn lb (about +2.4%); August up 1.8% | USDA cut butter and cheese price forecasts in September, raised nonfat dry milk | Production forecast to rise again in 2027; the US stays the world’s most competitive surplus supplier |
| European Union | Deliveries up about 3.1% Jan–Aug, but drought, heat and a weaker forage harvest are cutting yields | Farmgate near €42/100kg in August, stabilising; Arla added almost €1/100kg in September | Rabobank sees Q4 output down about 1.6%; structural limits (herd decline, environmental rules) cap any rebound |
| New Zealand | Record 2025 season; new season tracking well so far | Fonterra midpoint lifted to NZ$9.50/kgMS on firmer powder prices | El Niño is the key downside risk to spring and summer output |
| South America | Growth momentum weakening, though Argentina is still forecast slightly higher | Lower export competitiveness at current world prices | A smaller contributor to the global surplus than in 2025 |
| Australia | The one major exporter that did not join the 2025 surge | Strong local pull for milk protein and whey investment | Measured growth, focused on value-added protein |
| China | Domestic oversupply eased; imports stabilising | Domestic dairy prices fell during the EU subsidy probe period, which Beijing cited as injury | Signs of stabilisation support powder and protein demand |
| South Africa | Producer numbers down to 879 (January 2026) from 1,253 in 2020, with output per farm up about 44% | Margin squeeze as input costs outpace milk prices; foot-and-mouth outbreaks have cost the sector an estimated R1bn | Further consolidation toward large, high-tech units in the Western Cape, KZN and Eastern Cape |
Why this matters for you: in 2027 the marginal tonne of cheese, butter and powder is likely to come from the US. Buyers in Asia, the Middle East and Africa should expect more US-origin offers and should test them against European and Oceania supply.
5. Trade and geopolitics: duties, war and freight
Trade policy and conflict did not cause the glut, but they decided where the surplus could go and what it cost to ship.
China locks in duties on EU dairy. On 12 February, China’s Ministry of Commerce issued its final ruling in the anti-subsidy probe it opened in August 2024. EU cheeses and high-fat milk and cream now face duties of 7.4% to 11.7% for five years. The 14 sampled companies got individual rates, other cooperating firms 9.5%, and everyone else the top 11.7%. That is far below the 21.9% to 42.7% provisional rates set in December 2025, but it still tilts the field. Chinese analysts expect New Zealand and Australian suppliers to pick up the share EU exporters lose.
The Middle East shock. The conflict that began on 28 February disrupted shipping through the Strait of Hormuz, which normally carries 20% to 30% of global fertiliser exports and a large share of the world’s urea. Middle East urea prices rose by roughly a fifth within the first week. A ceasefire was announced on 8 April, but traffic through the Strait stayed well below pre-war levels for months. For dairy, the effects ran through three channels:
- Fertiliser. Nitrogen is the input dairy farmers worry about most, and pasture-based systems in Europe and Oceania are especially exposed.
- Freight and insurance. Carriers serving the Gulf and Red Sea added war-risk surcharges on refrigerated cargo, raising the landed cost of dairy into the region.
- Gulf demand. The Gulf states are major buyers of milk powder, butter and cheese. Shipping disruption made a key import region harder and more expensive to serve.
EU export volume up, value down. EU dairy exports rose about 8% by volume in the first half of 2026, but revenue fell about 2%. Europe moved more product at lower prices, which is what you would expect in a glut with China partly closed.
Why this matters for you: geopolitics now sets the floor under your input costs. Even if commodity prices stay moderate, fertiliser, energy and freight will keep farmgate costs elevated, and that limits how far milk prices can fall from here.
6. Farm economics: the squeeze moves from price to cost
The first half of 2026 squeezed farmers through low milk prices. The second half is squeezing them through rising costs. That shift is what will finally slow supply.
Costs turned up. Cheap feed fuelled the 2025 expansion. That tailwind is fading. Eurostat reports EU agricultural input prices rose 4.7% year on year in Q2 2026, after a long stable stretch, while milk prices fell 16.6%. Drought has hurt forage crops across parts of Europe, and the EU maize harvest is expected to come in 6% to 7% lower. Rabobank flags rising feed, energy, fertiliser and freight costs across all major exporters.
Beef-on-dairy changes the herd math. In the US, strong prices for beef-cross calves give dairy farmers a second income stream that has helped them ride out weak milk cheques. The flip side is fewer dairy replacement heifers. USDA notes that heifers are scarce and expensive, which limits how fast the US herd can grow, even as farmers keep more cows in milk for longer.
The consolidation wave. Low prices and high costs hit smaller operations hardest. Industry analysts expect 2026 to accelerate consolidation at both farm and processor level. South Africa shows the long-run pattern clearly: producer numbers have fallen by about 30% since 2020 while output per farm has risen sharply. Similar trends are running across Europe and the US.
Processors are investing in protein, not volume. The big capital commitments this year have gone into whey, protein and value-added capacity rather than commodity drying. That will shift product mix over the next three to five years.
Why this matters for you: your supplier base is getting smaller and more concentrated. Fewer, larger suppliers often mean more reliable volume, but they also carry more pricing power. Check how concentrated your dairy spend has become.
7. The turn: Q4 is where the glut starts to break
The most important forecast of the year came out in September. Rabobank now expects milk output from the Big 7 exporters to contract in Q4 2026 and stay broadly flat through the first half of 2027. After two years of surplus, that is the turning point.
What is driving the turn:
- Europe is slowing first. Rabobank expects EU output to fall about 1.6% year on year in Q4. Ireland’s drought has already cut production, with June down 3.4% and July down 2.2%.
- South America is losing momentum as lower world prices hit export margins.
- New Zealand faces El Niño. If dry conditions arrive this spring and summer, pasture growth and milk output could fall short of current expectations.
- Costs are biting. With feed, fertiliser and energy all higher, marginal milk is becoming unprofitable to produce.
What could stop it: the US. USDA raised its 2026 and 2027 milk forecasts again in September, with 2027 output now projected at about 238.6 billion pounds. If US growth stays strong while other regions slow, the global market may rebalance more slowly than the Rabobank view suggests.
Early price signals:
- European farmgate prices stabilised in August and rose in nine EU countries.
- IFCN estimates EU raw milk futures could reach about US$49 per 100kg by year end. Treat that as a projection, not a certainty.
- Fonterra’s September upgrade was driven by firmer whole and skim milk powder prices and steady buying from Asia and the Middle East.
- Traders at StoneX’s Dublin conference in September described the outlook for the final months of 2026 as relatively optimistic, mainly because of protein demand.
The honest caveat: global milk output is still above 2025 levels, and product stocks made during the glut have to clear first. The turn is a change in direction, not an instant rally. Fat and cheese in particular remain well supplied.
Why this matters for you: the risk balance has flipped. For most of 2026, waiting meant paying less. From Q4 onward, waiting is more likely to mean paying more, especially for powders and proteins.
8. Product-by-product outlook for buyers
The products are not moving together. Proteins and powders are firming, fat stays heavy, and cheese carries the most downside risk into 2027.
| Product | Where it is now | Q4 2026 to H1 2027 bias | Buyer stance |
|---|---|---|---|
| Whey protein (WPC 80, WPI) | Record highs; some demand fatigue at the top | Firm; easing only if new capacity lands | Secure annual volume; qualify alternative suppliers and blends |
| Standard whey powder | Record levels in Europe | Firm | Cover H1 2027 needs now |
| Skim milk powder / NFDM | Recovering; USDA raised NFDM price forecasts | Firming | Extend cover before Q4 supply contraction shows up in prices |
| Whole milk powder | Recovering from a roughly 30% slump; mid-September GDT slightly lower | Moderately firmer if El Niño hits NZ | Layer purchases; watch the 6 October GDT |
| Butter / AMF | Well supplied after the 40% fat collapse | Flat to soft | Stay short-dated; buy on dips |
| Cheese | Supply heavy; USDA cut cheese price forecasts; GDT cheddar volatile | Soft, with whey-driven capacity adding supply | Avoid long fixed-price contracts; use index-linked deals |
| Farmgate milk (EU, NZ) | Bottomed; EU prices edging up, Fonterra midpoint up | Rising into winter | Expect processor price increases to flow through |
These are directional calls built on the latest published forecasts. They are not price predictions, and they assume no new supply or demand shock.
The bottom line
2026 was not one story but two, layered on top of each other. The wall of milk drove commodity prices down and pushed farm margins to breaking point. Underneath it, the protein boom quietly rewired how the dairy industry makes money. As the glut fades, the second story becomes the main one.
The practical upshot: stop treating dairy as one market. Your protein buys, your fat buys and your cheese buys now need three different strategies.
Procurement playbook
Ordered by urgency.
- Lock protein and whey cover for H1 2027 now. Supply cannot respond quickly, and buyers who wait are competing with sports nutrition and GLP-1-driven brands with deep pockets.
- Extend powder cover before the Q4 contraction reaches prices. SMP and WMP are firming. Layer purchases over the next two or three GDT events rather than buying all at once.
- Keep butter and fat short-dated. Fat is still the most oversupplied part of the complex. Buy on dips and avoid long fixed-price commitments.
- Move cheese contracts to index-linked pricing. New whey-driven capacity could push cheese lower in 2027. Do not lock in today’s price for a year.
- Diversify origin. Test US-origin offers against EU and Oceania supply. Expect New Zealand and Australian suppliers to compete harder in China, where EU product now carries duties.
- Build El Niño into your Oceania plan. If you rely on New Zealand powder, agree contingency volumes with an alternative origin now.
- Budget for cost-driven farmgate increases. Fertiliser, energy and freight are pushing processor costs up, and those increases will reach your invoices in Q4 and Q1.
- Review supplier concentration. Consolidation is shrinking the supplier base. Map how much of your spend sits with your top two suppliers and qualify a third where you can.
- Price in freight and war-risk surcharges on any lanes touching the Gulf or Red Sea, and keep alternative routings on file.
Your 90-day call to action: run a product-by-product review of your dairy book before the year-end contracting season, when many 2027 supply agreements are set.
What to watch next
- Tuesday, 6 October: GDT auction. The first read on whether September’s powder recovery holds. Watch WMP and SMP above all.
- Tuesday, 20 October: GDT auction. Two consecutive gains in powders would confirm the turn.
- Mid-October: USDA WASDE. Any further upgrade to US milk output would weaken the case for a fast global rebalance.
- Around 22 October: USDA Milk Production report. September output and herd numbers. A slowdown from August’s 1.8% growth would be a bullish signal.
- Q4: EU milk delivery data. Confirmation, or not, of Rabobank’s forecast for a roughly 1.6% fall.
- New Zealand spring weather. Peak milk is now. Watch for El Niño-driven dry conditions and any Fonterra forecast change.
- Middle East shipping and fertiliser prices. Any renewed disruption in the Strait of Hormuz would lift both farm costs and freight.
In closing
Every dairy cycle ends the same way: low prices cure low prices. 2026 is following the script. The milk that flooded the market is drying up as costs climb and weather turns, and the buyers who used the glut to lock in cheap cover are sitting comfortably.
What makes this cycle different is protein. The industry that comes out of the glut will earn more of its money from whey and value-added ingredients and less from commodity fat. The smart move now is not to predict the next price spike. It is to split your dairy book by component and buy each part on its own fundamentals.