

Shanghai on-time arrivals fall to 21%, jet fuel more than doubles, and the UP–NS megamerger clears its first hurdle.
The year in one sentence
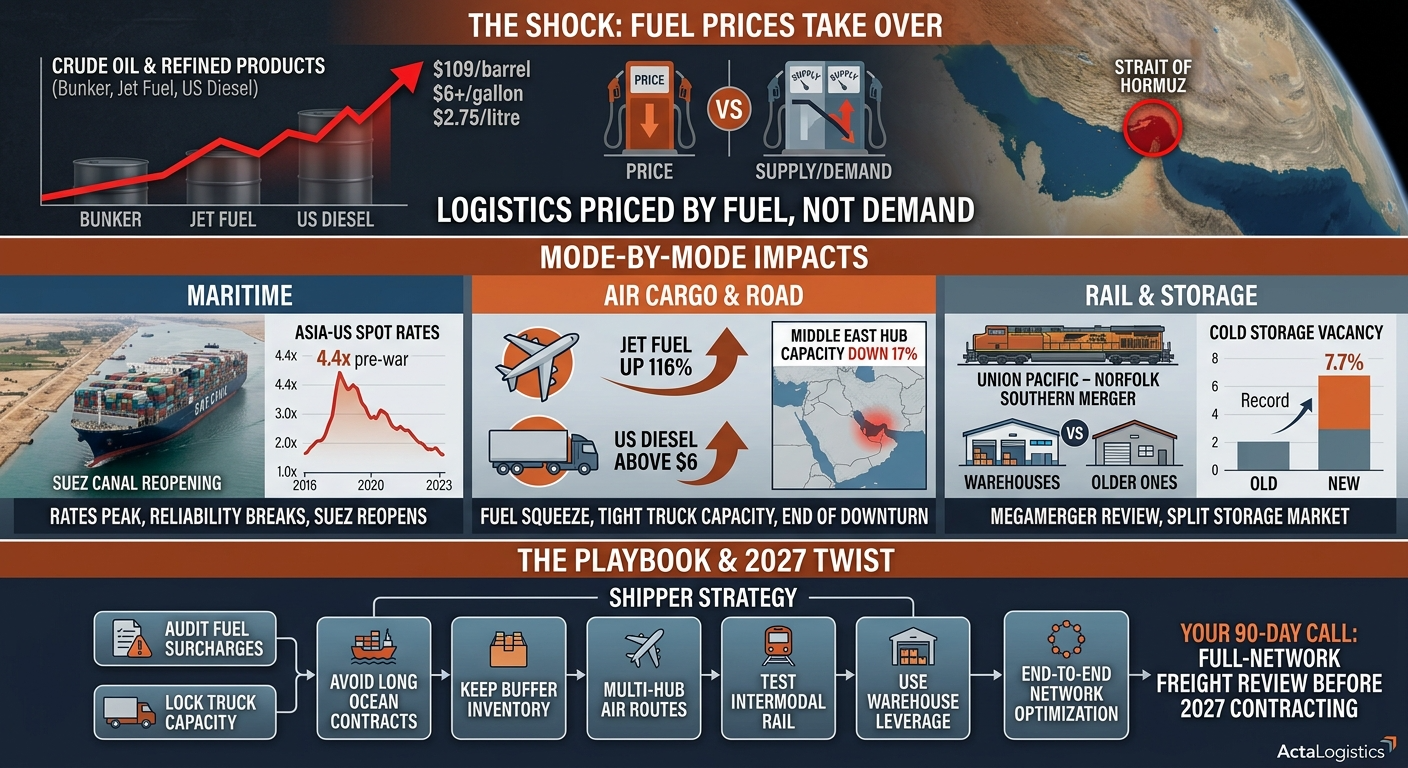
In 2026, logistics stopped being priced by supply and demand and started being priced by fuel.
The war that began on 28 February closed most traffic through the Strait of Hormuz, a key route for the world’s oil, gas and fuel. The shock hit every mode at once:
- Ocean carriers passed on soaring bunker costs and war-risk surcharges.
- Jet fuel more than doubled, cutting air cargo capacity through Gulf hubs.
- US diesel hit an all-time record above $6 a gallon, just as truck capacity was already tightening.
Underneath the fuel story, the industry is also being reshaped structurally. The proposed Union Pacific–Norfolk Southern merger would create America’s first coast-to-coast railroad. Cold storage vacancy hit a record as older warehouses lost tenants to new ones. And container shipping faces a wave of new ships just as routes through Suez begin to reopen.
This Sunday Strategy edition follows the shock across all three ActaLogistics verticals, Maritime, Rail and Road, and Storage, and sets out what shippers should lock in before 2027.
Your 30-second scan
- The fuel shock: how one closed strait repriced ships, planes and trucks
- Maritime: spot rates peak at about 4.4x pre-war, reliability collapses, and Suez begins to reopen
- Air cargo: jet fuel up 116% year on year, with Gulf capacity still down 17%
- Road: record diesel, tight truck capacity and the end of a 42-month freight downturn
- Rail: the UP–NS megamerger moves to a full review
- Storage: record cold storage vacancy and a split industrial market
- The playbook: mode-by-mode shipper calls and what to lock in now
1. The fuel shock: one strait, every mode
Every mode of freight burns fuel, so when the world’s most important energy chokepoint closed, every freight rate moved together.
What happened. After the war began on 28 February, traffic through the Strait of Hormuz, which normally carries about a fifth of the world’s oil, fell to a fraction of normal. The International Energy Agency called it the largest supply disruption in the history of the global oil market. A ceasefire was announced on 8 April, but shipping through the Strait stayed well below pre-war levels. Renewed attacks in early September pushed oil back up toward $109 a barrel.
The fuel scoreboard:
| Fuel | Peak or latest move | Main effect |
|---|---|---|
| Bunker fuel (ships) | Up almost 70% in the early months | Ocean freight rates and emergency surcharges |
| Jet fuel | Up more than 116% year on year in mid-September (IATA) | Air cargo rates and capacity |
| US diesel | Record $6.285 a gallon on 14 September, up 68% in a year (EIA); about $6.53 the following week | Trucking costs and fuel surcharges |
| Canadian diesel | Record of about C$2.75 a litre in September | Cross-border trucking costs |
Refining is the hidden bottleneck. Jet fuel and diesel have risen much faster than crude oil, because refining capacity is stretched. US refineries are running close to full capacity as global diesel shortages pull US supply abroad. IATA expects jet fuel to average about $152 a barrel in 2026, nearly 70% higher than last year.
Surcharges went weekly. Carriers moved to faster fuel surcharge resets. UPS and FedEx now adjust weekly, and many air carriers switched to an emergency weekly mechanism once jet fuel crossed about $101 a barrel. Fuel is now repriced every few days rather than every few months.
Why this matters for you: fuel surcharges now make up a larger share of the total freight bill on almost every lane. Audit your surcharge exposure by mode, and make sure your contracts specify how fuel is indexed and how often it resets.
2. Maritime: rates peak, reliability breaks, Suez reopens
Ocean freight took the most direct hit from the Hormuz crisis. It is now moving into a new and possibly tricky phase.
The rate spike. Spot container rates had been falling at the start of 2026. Once the Strait closed, they reversed sharply:
- In early March, Drewry’s World Container Index was just under $2,000 per 40-foot container.
- By late June it had passed $4,000, a 22-month high.
- War-risk surcharges of roughly $1,500 to $4,000 per container were added on Gulf-linked lanes.
- Some routes touching the Middle East saw total shipping costs rise 125% to 180%.
Peaked, but high. On 1 October, Xeneta said Far East–US spot rates have reached their post-crisis peak. They are still about 335% to 345% above where they stood on 28 February, and Xeneta expects them to stay high for the rest of the year. US East Coast rates could reach $6,000 to $7,000 per container in the next three months. The gap between East and West Coast rates has widened from about $770 to more than $3,100 per container.
Reliability broke down. Long routes around the Cape of Good Hope, bad weather and vessel bunching overwhelmed Asian ports in mid-2026. Sea-Intelligence reports that global schedule reliability fell 6.1 percentage points in July to about 56%, the steepest monthly drop since January 2021. Every one of Asia’s 14 busiest ports saw reliability decline. In Shanghai, only 21% of vessels arrived on time in July, the worst in 14 years of data outside the pandemic. Late ships were running about six days behind.
Suez reopens. Congestion is pushing carriers back toward Suez. MSC, Maersk, CMA CGM and others have started shifting Asia–Europe services back to the Suez Canal, with about 19% of Asia–Europe capacity already off the Cape route. The Suez Canal Authority is offering fee discounts to encourage the return.
The next risk is overcapacity. Port congestion currently ties up about 2.3 million TEU of vessel capacity. As congestion clears and Suez shortens voyages, that capacity will come back into the market alongside a heavy wave of new ships. Analysts warn that demand measured in TEU-miles could contract by around 8.7% in the first half of 2027.
Why this matters for you: do not lock long-term ocean contracts at today’s peak. If Suez routing returns at scale, rates could fall sharply in 2027. Use shorter contracts or index-linked pricing, and keep buffer stock while reliability stays low.
3. Air cargo: the Gulf hubs and the jet fuel squeeze
Air cargo felt the war twice: once through the loss of Gulf hub capacity, and again through jet fuel prices.
The capacity shock. Dubai, Doha and Abu Dhabi connect Europe, Asia and Africa for much of the world’s air cargo. When the war began, Xeneta estimated that roughly 12% of global air cargo capacity disappeared almost overnight. In March, demand on Middle Eastern carriers fell about 54% and their capacity about 52%, according to IATA. Doha’s outbound cargo capacity fell 77% year on year in one week in late March.
A slow recovery. Gulf airlines have been rebuilding since the April ceasefire. Middle East air cargo demand grew 2% year on year in July. But capacity to and from the Gulf was still about 17% below its pre-war level in mid-September, and some global carriers continue to avoid the region.
Fuel keeps rates high. IATA reports jet fuel up more than 116% year on year as of mid-September. Air freight rates have stayed unusually firm through what is normally the quiet summer season:
- The global Baltic Air Freight Index was about 21% higher than a year earlier in late September.
- Average worldwide spot rates were about $3.45 per kilo in mid-September.
- Xeneta now expects full-year 2026 contract rates to rise 5% to 15%, reversing its original forecast of a 5% to 10% fall.
Other moves. The EU’s end to its duty exemption for low-value parcels in July cut small-parcel volumes from China to Europe. Poor ocean reliability has kept some freight in the air that would normally move by sea.
Why this matters for you: air is still the fallback when ocean reliability fails, but you will pay a premium. If Gulf capacity fully recovers and jet fuel eases, spot rates should fall. Until then, avoid single-hub routing for time-critical cargo and budget for elevated fuel surcharges into Q4.
4. Road: record diesel meets a tighter truck market
For US trucking, 2026 brought two shifts at once: fuel costs at record highs, and the long freight recession finally ending.
The diesel record. The EIA’s weekly average for on-highway diesel hit an all-time record of $6.285 a gallon on 14 September, up nearly 32 cents in a week and 68% in a year. Industry trackers put it at about $6.53 the following week, with East Coast prices around $6.26 and California above $8. Small carriers that depend on the spot market feel this most, because they have the least fuel-surcharge protection.
The downturn is over. After years of oversupply, truck capacity has left the market faster than freight volumes have fallen:
- The Cass Truckload Linehaul Index rose 11.3% year on year in August, the biggest gain since June 2022, ending a 42-month downturn for carriers.
- Including fuel, truckload expenditures were up 18.7% year on year.
- Dry van spot linehaul rates, excluding fuel, averaged about $2.20 a mile in mid-September, up 34% on a year earlier and 21% above the nine-year seasonal average.
- Including fuel, all-in spot rates are around $3.40 a mile.
- Tender rejections, where carriers turn down contracted loads for better spot offers, are running around 14%.
Demand is still uneven. Freight volumes remain softer than a year ago in some sectors, and DAT recorded the sharpest August drop in linehaul rates on record, partly because freight had been pulled forward earlier in the summer. This is a capacity-driven market, not a demand boom. Carrier costs have also climbed steadily: the American Transportation Research Institute puts trucking’s operating cost per mile at $2.34 in 2025, up from $1.65 in 2020.
The outlook. ACT Research expects tighter capacity and a modest demand improvement to keep upward pressure on truckload rates for the next 12 to 18 months.
Why this matters for you: the era of cheap truckload capacity is over for now. Lock contract capacity with reliable carriers before Q4 peak, expect contract rates to reset higher in 2027 bids, and review fuel surcharge tables, which were built for $3 to $4 diesel, not $6.
5. Rail: the megamerger moves to a full review
The biggest structural story in US freight transport this year is a deal that has not closed yet: Union Pacific’s proposed takeover of Norfolk Southern.
What is at stake. Combining the largest western railroad with a major eastern one would create America’s first coast-to-coast freight railroad. The companies say a seamless network would offer faster, more efficient service and take more than 2 million truckloads off US highways. Opponents, including rival railroad CN, argue the merger would concentrate around 40% of US freight rail traffic in one company and reduce competition.
The regulatory road so far:
- July 2025: merger agreement signed; both companies’ shareholders later approved it.
- 19 December 2025: joint application filed with the Surface Transportation Board (STB).
- 16 January 2026: STB rejected the application as incomplete, without dismissing the case.
- 30 April: revised application filed.
- 28 May: STB accepted the revised application but paused the review and demanded more information by 27 July.
- 18 August: STB lifted the pause and set a procedural schedule for a review on the merits.
- 18 September: STB unanimously denied opponents’ requests to dismiss the application without a full review.
What comes next. This is the first major railroad merger to be judged under the STB’s tougher rules for large rail consolidations. The board has stressed it has not approved the deal. Expect months of public comment, environmental review and requests from shippers and rival railroads for protective conditions.
The fuel angle. With diesel above $6 a gallon, rail’s fuel efficiency advantage over trucks matters more. A single-line coast-to-coast service could make long-haul intermodal more attractive, if it delivers the service reliability shippers need.
Why this matters for you: shippers on either network should take part in the STB process if they have concerns about competition or access. In the meantime, test intermodal options on long-haul lanes where high diesel prices have narrowed the cost gap with trucking.
6. Storage and warehousing: a market split by age and size
Warehousing did not get a single big shock in 2026. It got a slow sorting-out, with modern buildings winning, older ones losing, and higher energy costs adding pressure.
Cold storage: record vacancy. Newmark reports that US cold storage recorded negative net absorption in the first half of 2026, meaning more space was vacated than leased. About 56 million cubic feet of move-outs met 41 million cubic feet of new deliveries. It was the first first-half decline since 2007, and it pushed vacancy to a record 7.7%.
The split is by age:
| Building era | Vacancy (1H 2026) | What is happening |
|---|---|---|
| Built before 2006 | 8.2% | Holds 68% of all vacant cold space; nearly all the move-outs |
| Built 2006–2019 | 3.4% | The tightest segment |
| Built since 2020 | 10.9% | Still leasing up after heavy recent construction, but absorbing almost all new demand |
Tenants are moving out of older, less efficient facilities and into modern ones with better automation and energy performance. With power prices higher, efficiency matters even more. Newmark expects the second half to improve on large scheduled move-ins, but vacancy will stay above the long-term average.
General industrial: levelling off. National industrial vacancy has stabilised at roughly 7% after two years of increases. The market is split by size:
- Small-bay space under 50,000 square feet is the tightest, at around 4.8% vacancy.
- Mid-size buildings are the softest, at roughly 8% to 9%.
- Big-box space is tightening fast.
New construction starts are near decade lows, which should squeeze supply over the next two years. Demand is spread across e-commerce, reshored manufacturing, including the pharma onshoring wave, and spillover from data centre development.
Regional contrasts. Chicago’s overall industrial vacancy stood around 4.7% at the end of 2025, but parts of its I-80 corridor are above 12% after heavy new building. Seattle and Portland have softened, while Silicon Valley has tightened.
Why this matters for you: occupiers have negotiating leverage in older cold storage and mid-size buildings today, but that window will narrow as construction dries up. Lock in favourable lease terms in 2026, and favour modern, energy-efficient space where power costs are a large part of operating expense.
7. The cascade: how the three verticals connect
No logistics mode moved alone in 2026. A shock at sea worked its way to the highway and into the warehouse. Here is the chain:
- Hormuz closes, and fuel spikes. Bunker, jet fuel and diesel all jump, so every mode reprices at once.
- Ships take longer routes, and reliability collapses. Cape diversions and Asian port congestion push on-time arrivals to post-pandemic lows.
- Shippers react with buffers. Unreliable ocean schedules push urgent freight into the air at premium rates and encourage importers to carry more inventory.
- Extra inventory needs space. More safety stock lifts demand for modern, well-located warehouses, while older buildings lose tenants.
- Inland freight gets more expensive. Late, bunched vessel arrivals strain ports and drayage, and record diesel prices raise every truck move from port to warehouse to store.
- High diesel makes rail more attractive. The cost gap between truck and long-haul intermodal narrows, raising the stakes in the UP–NS merger review.
- Cold chain is squeezed at both ends. Reefer cargo pays the highest war-risk surcharges at sea, while cold stores pay more for power, accelerating the move out of older, less efficient facilities.
The 2027 twist. If Suez routing returns at scale and new ships keep arriving, the chain could run in reverse: ocean rates fall, buffer stock is unwound, and some warehouse demand fades. Trucking and diesel, however, are tied to a refining squeeze that may last longer.
Why this matters for you: freight decisions in one mode change costs in the others. Model your network end to end, from origin port to final mile, rather than buying each mode in isolation.
8. Mode-by-mode outlook for shippers
Ocean rates have peaked but could fall hard in 2027. Trucking and diesel look stickier. Warehousing favours tenants today but will tighten.
| Mode | Where it is now | Q4 2026 to H1 2027 bias | Shipper stance |
|---|---|---|---|
| Ocean, Asia–US | Spot about 4.4x pre-war; post-crisis peak | Elevated through year end; downside risk in 2027 | Short contracts or index-linked pricing; avoid locking peak rates |
| Ocean, Asia–Europe | Suez return under way; congestion easing slowly | Softer as Suez routing scales up | Watch Suez capacity; keep buffer stock for now |
| Gulf-linked lanes | War-risk surcharges; services disrupted | Volatile | Use alternative routings; price in surcharges |
| Air cargo | Rates about 21% higher than a year ago; jet fuel more than double | Firm into peak; easing if Gulf capacity recovers | Avoid single-hub routing; book peak capacity early |
| US truckload | Record diesel; tender rejections about 14% | Firm for 12 to 18 months (ACT) | Lock contract capacity; update fuel tables |
| US rail and intermodal | UP–NS merger under full STB review | Stable rates; strategic uncertainty | Test intermodal on long-haul lanes; engage in STB review |
| Cold storage | Record 7.7% vacancy; older stock weakest | Gradual improvement | Negotiate hard on older space; favour efficient buildings |
| General warehousing | About 7% vacancy; construction at decade lows | Tightening into 2027 | Lock leases in 2026 |
These are directional calls based on the latest published data. They are not rate forecasts and assume no major new escalation in the Gulf.
The bottom line
2026 is the year fuel took over the freight rate card. One closed strait raised the cost of moving goods by sea, air and road at the same time, and exposed how much of global logistics relies on a few chokepoints and hubs.
The next phase will not be uniform. Ocean freight is approaching an overcapacity cliff as Suez reopens and new ships arrive. Trucking, by contrast, faces a tighter market and a refining squeeze that could keep diesel high for longer. The winners in 2027 will be the shippers who buy each mode according to its own cycle, rather than assuming everything moves together.
Shipper playbook
Ordered by urgency.
- Audit fuel surcharge exposure across every mode. Confirm how fuel is indexed, how often it resets, and whether your tables were built for today’s prices.
- Lock truckload contract capacity before Q4 peak. Capacity is tight, and 2027 bids will reset higher.
- Avoid long ocean contracts at peak rates. Use shorter terms or index-linked pricing to benefit if Suez routing pushes rates down in 2027.
- Keep buffer inventory while ocean reliability stays low, but plan to unwind it when schedules recover.
- Remove single-hub dependence for air cargo. Build alternative routings through Asian hubs for time-critical freight.
- Test intermodal on long-haul lanes. High diesel prices have narrowed the cost gap with trucks.
- Engage in the UP–NS review if you ship on either network. Protective conditions are negotiated now, not after approval.
- Use 2026 warehouse leverage. Lock favourable lease terms in older cold storage and mid-size buildings before new construction runs out.
- Model the network end to end. Ocean, air, road, rail and storage costs now move together, so optimise across them, not within each one.
Your 90-day call to action: run a full-network freight review before 2027 contracting season, mode by mode and lane by lane, with fuel at today’s prices built in.
What to watch next
- Strait of Hormuz traffic and oil prices. Any lasting reopening would ease fuel costs across every mode. Renewed attacks would reverse the trend.
- Weekly EIA diesel prices. Watch whether diesel holds above $6 into winter heating season, when demand for distillates usually rises.
- Suez Canal capacity share. The faster Asia–Europe services move back to Suez, the sooner ocean rates are likely to fall.
- Sea-Intelligence schedule reliability data. A recovery from July’s lows would signal congestion is clearing.
- Xeneta and Drewry rate indices. Watch US East Coast rates against Xeneta’s $6,000 to $7,000 forecast.
- Q4 peak season air cargo. Gulf capacity recovery and jet fuel prices will decide whether air rates rise or ease.
- The UP–NS merger schedule. Comment deadlines and protective condition requests from shippers and rival railroads.
- Second-half cold storage data. Newmark expects large move-ins to improve the picture. Confirmation would signal the bottom.
- 2027 truckload bid season. Contract rate resets will show how much of today’s tightness becomes permanent.
In closing
For most of the last decade, logistics was a story of capacity: too many ships, too many trucks, then too few, then too many again. 2026 added a new driver. Fuel, set by events in a single strait, became the price-setter for every mode at once.
The smartest shippers are not betting on fuel coming down. They are building networks that still work when it does not: shorter and index-linked ocean contracts, locked truck capacity, multi-hub air routings, modern storage and rail options for long haul. Flexibility, not the lowest rate, is what wins in this cycle.