
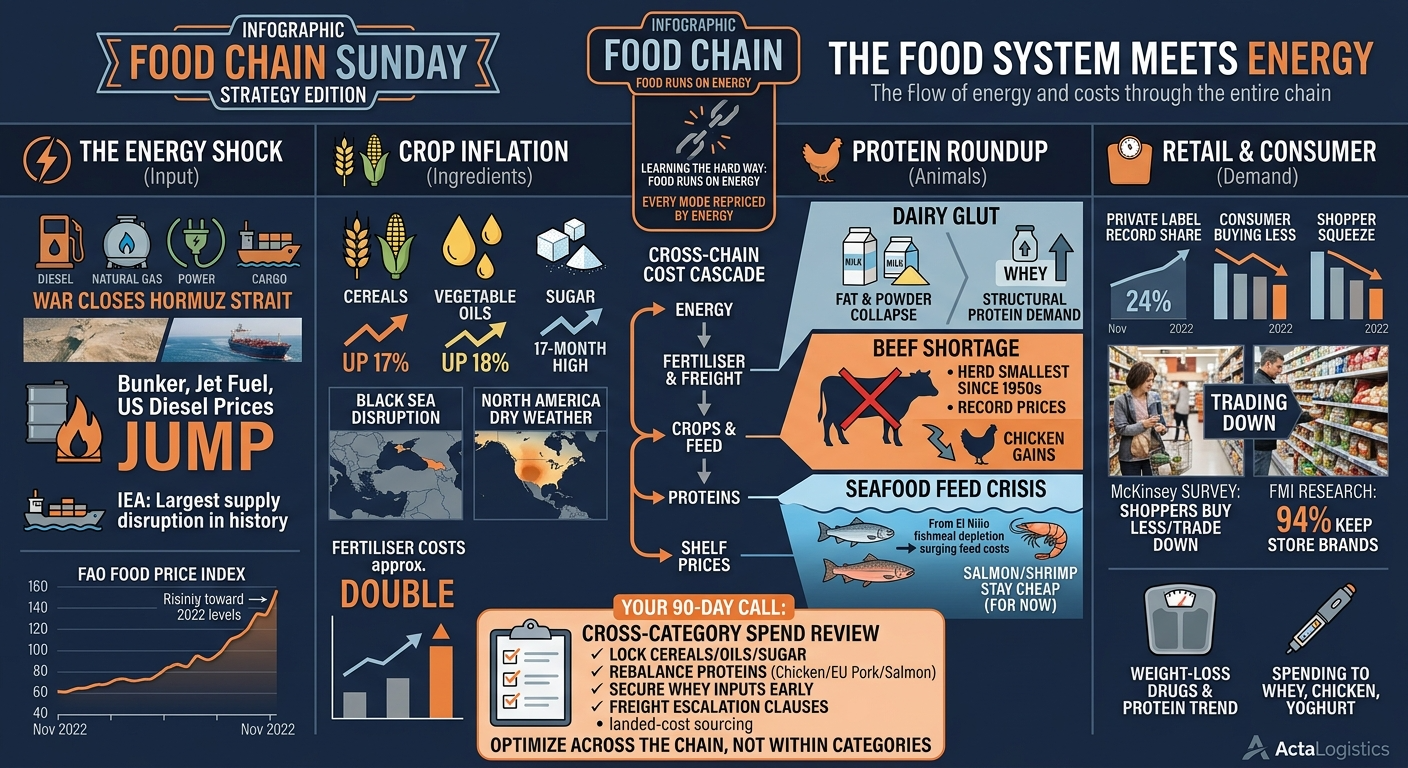

The FAO food index hits its highest since 2022, US-bound freight still more than four times pre-war levels, and private label takes a record share.
In 2026 the food system learned that it runs on energy, and when energy got expensive, everything from fertiliser to freight to the price on the shelf followed.
The war that began on 28 February shut most traffic through the Strait of Hormuz, one of the world’s key routes for oil, gas and fertiliser. Fuel, fertiliser and freight costs jumped, and global food commodity prices followed. In September the FAO Food Price Index reached its highest level since November 2022.
Underneath the cost shock, a quieter shift kept building. GLP-1 weight-loss drugs and the wider protein trend changed what people buy, and squeezed shoppers moved toward private label in record numbers.
Our three protein editions this weekend each told part of the story: a glut in dairy, a shortage in beef, and a feed crisis in seafood. This Food Chain edition connects them. It shows how one cost shock and one demand shift ran through every link of the chain, from the farm to the supermarket shelf.
Your 30-second scan
- The cost shock: energy, fertiliser and freight push the FAO index to a near four-year high
- Crops and ingredients: cereals up 17%, vegetable oils up 18% and sugar at a 17-month high
- Protein roundup: dairy’s glut, beef’s shortage and seafood’s feed crisis in brief
- The demand shift: GLP-1s, protein and the snack squeeze
- Retail and the consumer: private label hits record share as shoppers buy less
- Logistics: Asia–US freight still more than four times pre-war levels
- The playbook: cross-chain buying calls and what to lock in now
1. The cost shock: energy reprices the food chain
Food production uses energy at every step: diesel for tractors and trucks, natural gas for fertiliser, power for processing and refrigeration, and bunker fuel for ships. In 2026 all of those got more expensive at once.
How it started. The war that began on 28 February cut traffic through the Strait of Hormuz to a fraction of normal. The Strait normally carries about a fifth of global oil supply, large LNG volumes and between a fifth and a third of seaborne fertiliser exports. Brent crude jumped in the first days. A ceasefire was announced on 8 April and a US–Iran framework agreement followed later in the year, but shipping through the Strait stayed well below pre-war levels. Renewed attacks in early September pushed oil back up toward $109 a barrel.
The input bill. CoBank estimates fuel and fertiliser costs rose 20% to 40% after the war began. Some US industry estimates suggest fertiliser costs roughly doubled for some growers. In the US, energy prices were up about 16% year on year in August.
The commodity response. The FAO Food Price Index averaged 136 points in September 2026:
- up 1.5% on August and 5.8% on a year earlier
- the highest level since November 2022
- still about 15% below the March 2022 peak that followed Russia’s invasion of Ukraine
The FAO pins September’s rise on logistics problems in the Black Sea and around Hormuz, plus dry weather in North America. Its chief economist warns that, if sustained, these pressures will soon reach consumer prices, especially in countries that import a lot of food and energy.
The shelf lags the commodity. Retail prices have moved unevenly. In the UK, the Food and Drink Federation expects food inflation of at least 9% by the end of 2026, up from about 3.2% forecast before the war. In the US, grocery inflation actually cooled to 2.2% year on year in August, though beef, fish and fresh vegetables are rising much faster. USDA forecasts US food-at-home prices up about 2.5% in 2026.
Why this matters for you: commodity costs lead shelf prices by months. The cereal, oil and sugar increases of Q3 will show up in supplier price lists in Q4 and Q1. Plan for a fresh round of cost-push negotiations.
2. Crops and ingredients: where the inflation is
September’s FAO numbers draw a clear line: crops are getting more expensive while animal proteins are flat or falling. If you buy grains, oils or sugar, you are on the wrong side of that line.
Cereals: up 17% in a year. The FAO Cereal Price Index rose 5.1% in September and is 17.2% above a year earlier.
- Wheat rose 6.3% to its highest since August 2023, driven by logistics problems in the Black Sea and dry weather in parts of North America.
- Corn rose 5.6% to its highest in more than three years, on lower-than-expected US yields, reduced Brazilian export availability and Black Sea disruption.
- Rice gained 1.4% as Indica prices firmed on weather concerns and seasonally tighter supply.
Higher fertiliser costs add a second-round effect: farmers who cut nitrogen use this year may see lower yields next year.
Vegetable oils: up 18% in a year. The FAO Vegetable Oil Price Index edged up 0.9% in September and stands 18.3% above a year earlier, though soy and rapeseed oil were broadly stable during the month. Rabobank warns El Niño could threaten soybean and soybean oil output.
Sugar: three straight monthly rises. The FAO Sugar Price Index jumped 6.1% in September to its highest level since April 2025, about 15% above a year earlier, on expectations of tighter global supply in the 2026/27 season.
Fresh produce. USDA forecasts US retail fresh vegetable prices up 5.9% in 2026, more than double overall grocery inflation.
Why this matters for you: bakery, snacks, beverages, confectionery and anything fried or sweetened face the steepest input cost increases going into 2027. Cereal and oil prices also feed animal feed costs, which links straight back to the protein chains below.
3. The protein roundup: three chains, three stories
Animal protein moved against the commodity tide in September. The FAO Meat Price Index slipped 1.1% and was flat on a year earlier, and the Dairy Price Index is about 19% below a year ago. But each protein got there by a very different route.
Dairy: the wall of milk. Record 2025 output from the US, EU and New Zealand flooded the market. Fat and milk powder prices collapsed in early 2026, and EU farmgate milk prices are running about 19% below last year. Protein is the exception: whey prices hit records as GLP-1 users and health-focused shoppers chase protein. The turn has started, with Rabobank expecting output from the big exporters to contract in Q4 as rising fertiliser and energy costs bite. Full analysis in this weekend’s Dairy Chain Sunday Strategy.
Meat: the herd ran out. The US cattle herd started 2026 at its smallest size since the early 1950s. Cattle and beef prices set records, packers lost hundreds of dollars a head, and Tyson and JBS closed plants. The screwworm parasite kept the Mexican border closed for most of the year. Chicken won the trade-down, with Brazil exporting record volumes. In September, poultry prices fell on plentiful Brazilian supply and weaker EU import demand after new EU antimicrobial import rules took effect on 3 September. Full analysis in this weekend’s Meat Chain Sunday Strategy.
Seafood: the anchovy vanished. El Niño shrank Peru’s anchovy fishery, and global fishmeal output fell by nearly half through July. Feed costs for salmon and shrimp farms surged. Wild whitefish tightened too, with the Barents Sea cod quota at its lowest since 1991 and Alaska pollock catches well down. Farmed salmon and shrimp stayed cheap for now. Full analysis in this weekend’s Seafood Chain Sunday Strategy.
The common thread. Each protein chain felt the same two forces covered in this edition. Energy and fertiliser costs squeezed farm margins: they turned the dairy cycle, raised feedlot and packer costs, and compounded the fishmeal shock. The protein demand shift explains whey’s boom, chicken’s gains and the appeal of seafood to health-focused shoppers.
Why this matters for you: protein is where buyers have the most room to manoeuvre right now. Cheap dairy fat, chicken, European pork, farmed salmon and shrimp can offset expensive beef, cereals and oils.
4. The demand shift: GLP-1s and the protein economy
If energy is reshaping what food costs, GLP-1 drugs and the protein trend are reshaping what people buy. It is slower than the cost shock, but it is likely to last longer.
Less food, different food. GLP-1 users eat smaller portions and snack less. Research firm OC&C finds that behaviour became more structured and lasting in 2026. Spending is moving toward protein, fibre and nutrient-dense food:
- In an Acosta survey of US adults, GLP-1 users reported buying more yoghurt (32%), fresh chicken (31%) and protein shakes and powders (30%).
- OC&C lists prepared meats, yoghurt and seafood among the winners.
- Alcohol, sweet bakery, snacks and heavy, rich foods are the most exposed.
The price tag. Estimates of the volume hit vary widely:
- Big Chalk Analytics says GLP-1 use could cut US grocery sales by up to 2.7% this year, costing packaged food makers up to $21 billion.
- JPMorgan projects $30 billion to $55 billion in lost annual food and beverage sales by 2030.
- In Europe, ING estimates the current impact at only about 0.25% of total calorie demand.
- US snack unit sales held roughly steady through 2024, partly because some users treat snacks as mini-meals.
The protein economy. The clearest effect is in protein ingredients. Whey protein prices hit records this year (see the Dairy Chain edition), and protein-dense, gut-friendly products are winning. Kefir maker Lifeway posted its sixth straight year of volume-led sales growth. Nestlé, Chipotle and others are launching products aimed at GLP-1 users.
Investors are pricing it in. GLP-1 exposure is now part of due diligence in food M&A. Advisers say markets are pricing in the effect faster than the data can confirm it, which could undervalue some snack businesses and overvalue protein assets.
Why this matters for you: demand for protein ingredients will stay strong even as overall food volume flattens. Secure protein inputs early, and expect pressure on snack and confectionery volumes to continue.
5. Retail and the consumer: shoppers set the limit
The cost shock runs into a hard wall at the checkout. After years of food inflation, shoppers are buying less, switching stores and choosing store brands, and they are not switching back.
Volume is shrinking. US grocery prices are about a third higher than in 2019, and unit sales are falling. US grocery units were down 1.8% year on year in June. More than half of consumers say they are trading down to cheaper brands. In McKinsey’s March survey, shoppers reported delaying purchases, buying in bulk and trading down on fresh and premium items.
Private label’s record year. Store brands set an all-time US unit share record of 23.8% in the first half of 2026 and now take about 24% of food and beverage spending, worth roughly $330 billion. This is no longer just a trade-down:
- About 85% of shoppers in McKinsey’s survey say store brands match or beat national brands on quality.
- FMI research found 94% would keep buying store brands even if prices fell.
- Higher-income shoppers are adopting store brands too.
Retailers are doubling down. McKinsey found nearly all grocery retailers plan to increase private label investment over the next two to three years:
- Walmart is expanding its premium bettergoods line toward about 1,000 items.
- Target plans 600 new store-brand food and drink products over two years.
- Kroger is adding 870 private label items.
- BJ’s is cutting about a fifth of its product range.
The bifurcated basket. Shoppers are trading down on routine staples and trading up selectively on premium, health-focused and functional products. The squeezed middle, mid-priced brands with no clear edge, is losing shelf space fastest.
Brands feel the pinch. Food manufacturers are caught: raise prices and lose shoppers to store brands, or hold prices and absorb higher costs. Some long-established brand owners have seen their shares fall sharply this year.
Why this matters for you: suppliers with private label capability hold the stronger hand in 2027 negotiations. Brand owners need clear differentiation, whether health, protein or genuine quality, to justify any price increase.
6. Logistics: freight is the hidden tax
In 2026 shipping costs turned from a footnote into a real line item. Rates have peaked, but they are not coming back down quickly.
The freight spike. Once the Strait of Hormuz closed, carriers passed on sharply higher fuel costs. Bunker fuel prices rose almost 70% in the early months of the crisis, and the Shanghai container freight index doubled. Carriers added war-risk surcharges of roughly $1,500 to $4,000 per container on Gulf-linked lanes. By late June, Drewry’s World Container Index had passed $4,000 per 40-foot container, a 22-month high.
Peaked, not falling. Freight analytics firm Xeneta said on 1 October that Far East to US spot rates have reached their post-crisis peak. They are still about 335% to 345% above where they stood on 28 February. Xeneta expects rates to stay high for the rest of the year, with US East Coast rates possibly reaching $6,000 to $7,000 per container over the next three months. The gap between East and West Coast rates has widened from about $770 to more than $3,100 per container.
Routes are shifting. Some carriers began a limited return of Asia–Europe services through the Suez Canal in mid-September, while Gulf services remain disrupted. Every routing change adds transit time and planning risk.
Cold chain feels it most. Refrigerated cargo carries the highest war-risk surcharges into the Gulf and Red Sea. Air-freighted seafood took an immediate hit from jet fuel costs, according to FMI, the US Food Industry Association. Exporters serving the Gulf, a major market for poultry, dairy powders and beef, face both higher costs and less predictable delivery. Our ActaLogistics newsletters track these lanes daily.
Why this matters for you: freight is now a meaningful share of landed cost on imported ingredients. Build freight escalation clauses into 2027 supply contracts, and compare total landed cost, not just FOB price, when choosing between origins.
7. Cross-chain outlook for buyers
Crops, freight and beef are the cost pressure points. Dairy fat, chicken, European pork and farmed seafood are where buyers can find relief.
| Category | Where it is now | Q4 2026 to H1 2027 bias | Buyer stance |
|---|---|---|---|
| Wheat and corn | Multi-year highs; cereals up 17% in a year | Firm; weather and Black Sea risk | Extend cover; watch fertiliser-driven yield risk |
| Vegetable oils | Up 18% in a year | Firm; El Niño risk to soy | Lock H1 2027 volume |
| Sugar | Highest since April 2025 | Firm on tighter 2026/27 supply | Cover early |
| Dairy proteins (whey, SMP) | Whey at records; powders firming | Firm | Secure protein inputs now |
| Dairy fat and cheese | Well supplied | Flat to soft | Stay short-dated |
| Beef | Record US prices; herd at a 75-year low | Firm through 2027 | Secure volume; flex specs |
| Chicken | Strong trade-down demand; Brazil at record exports | Firm, with bird flu risk | Lock core volume; second origin |
| Pork | EU cheap after Spain’s ASF outbreak | Soft in EU | Use EU value while it lasts |
| Farmed salmon and shrimp | Cheap now; feed costs surging | Firmer in 2027 | Lock contracts while soft |
| Wild whitefish | Cod and pollock at record prices | Tight | Secure cover; substitute where possible |
| Ocean freight | Peaked; Asia–US spot still about 4.4x pre-war | Elevated through year end | Escalation clauses; landed-cost sourcing |
These are directional calls built on the latest published data. They are not price predictions and assume no major new geopolitical, weather or disease shock.
The bottom line
2026 is a year of two forces pulling on the same food system. Energy and logistics pushed costs up from the farm gate to the port. Shoppers and the protein shift pushed back from the checkout. Caught in the middle are processors, brands and buyers, who can no longer simply pass every cost increase through.
The practical upshot: stop managing food costs one category at a time. Rising crop and freight costs can be partly offset by cheaper proteins, smarter sourcing and a sharper private label strategy, but only if you look across the whole chain.
Procurement playbook
Ordered by urgency.
- Lock H1 2027 cover on cereals, vegetable oils and sugar. These are the categories where commodity prices are rising fastest, and the increases have not fully reached supplier price lists yet.
- Rebalance your protein mix. Shift volume toward value proteins (dairy fat, chicken, EU pork, farmed salmon and shrimp) to offset expensive beef and whitefish.
- Secure protein ingredients early. Whey and dairy protein demand is structural, not seasonal.
- Write freight escalation clauses into 2027 contracts. Spot rates have peaked but will stay well above pre-war levels.
- Source on landed cost, not FOB price. Freight and surcharges can flip which origin is cheapest.
- Prepare for cost-push negotiations in Q4 and Q1. Ask suppliers to show how energy, fertiliser and freight affect their costs, and agree indexation instead of open-ended increases.
- Build a private label strategy. Whether you are a retailer, foodservice operator or manufacturer, store-brand capability is now a source of negotiating power.
- Audit GLP-1 exposure in your portfolio. Shift innovation and promotion toward protein, fibre and portion-controlled formats.
- Map Gulf and Red Sea exposure across all inbound and outbound lanes, and keep alternative routings ready.
Your 90-day call to action: run one cross-category review of your 2027 food spend before year-end contracting. Do not run four separate category reviews. The savings sit in the trade-offs between categories.
What to watch next
- Mid-October: US September CPI and USDA’s WASDE. Watch whether grocery inflation starts to reflect Q3’s commodity increases, and whether US corn and wheat yields are revised down further.
- Early November: the FAO Food Price Index for October. A fourth monthly rise in sugar or a further jump in cereals would confirm the crop-led inflation trend.
- Strait of Hormuz and oil prices. Any lasting reopening would ease fuel, fertiliser and freight costs. Renewed attacks would do the opposite.
- Weekly freight indices from Drewry and Xeneta. Watch whether US East Coast rates climb toward the $6,000 to $7,000 range Xeneta expects.
- NOAA El Niño updates. El Niño matters for soybeans, sugar, Peruvian anchovy and New Zealand dairy all at once.
- Q3 food company results in October and November. Listen for volume trends, private label share and GLP-1 commentary.
- Year-end contracting season. The prices and terms you agree in the next eight weeks will set your 2027 cost base.
In closing
The food system has always been connected, but 2026 made the connections impossible to ignore. A closed strait in the Gulf raised the cost of fertiliser in Iowa, freight to Rotterdam and bread in London. A weight-loss drug changed what sells in the dairy aisle. A warm current off Peru raised the price of farmed salmon.
The buyers who come out ahead in 2027 will be the ones who stop looking at food one category at a time. Costs are rising in crops and freight, relief is available in parts of the protein chain, and shoppers are drawing a hard line on what they will pay. The opportunity lies in managing all three together.