
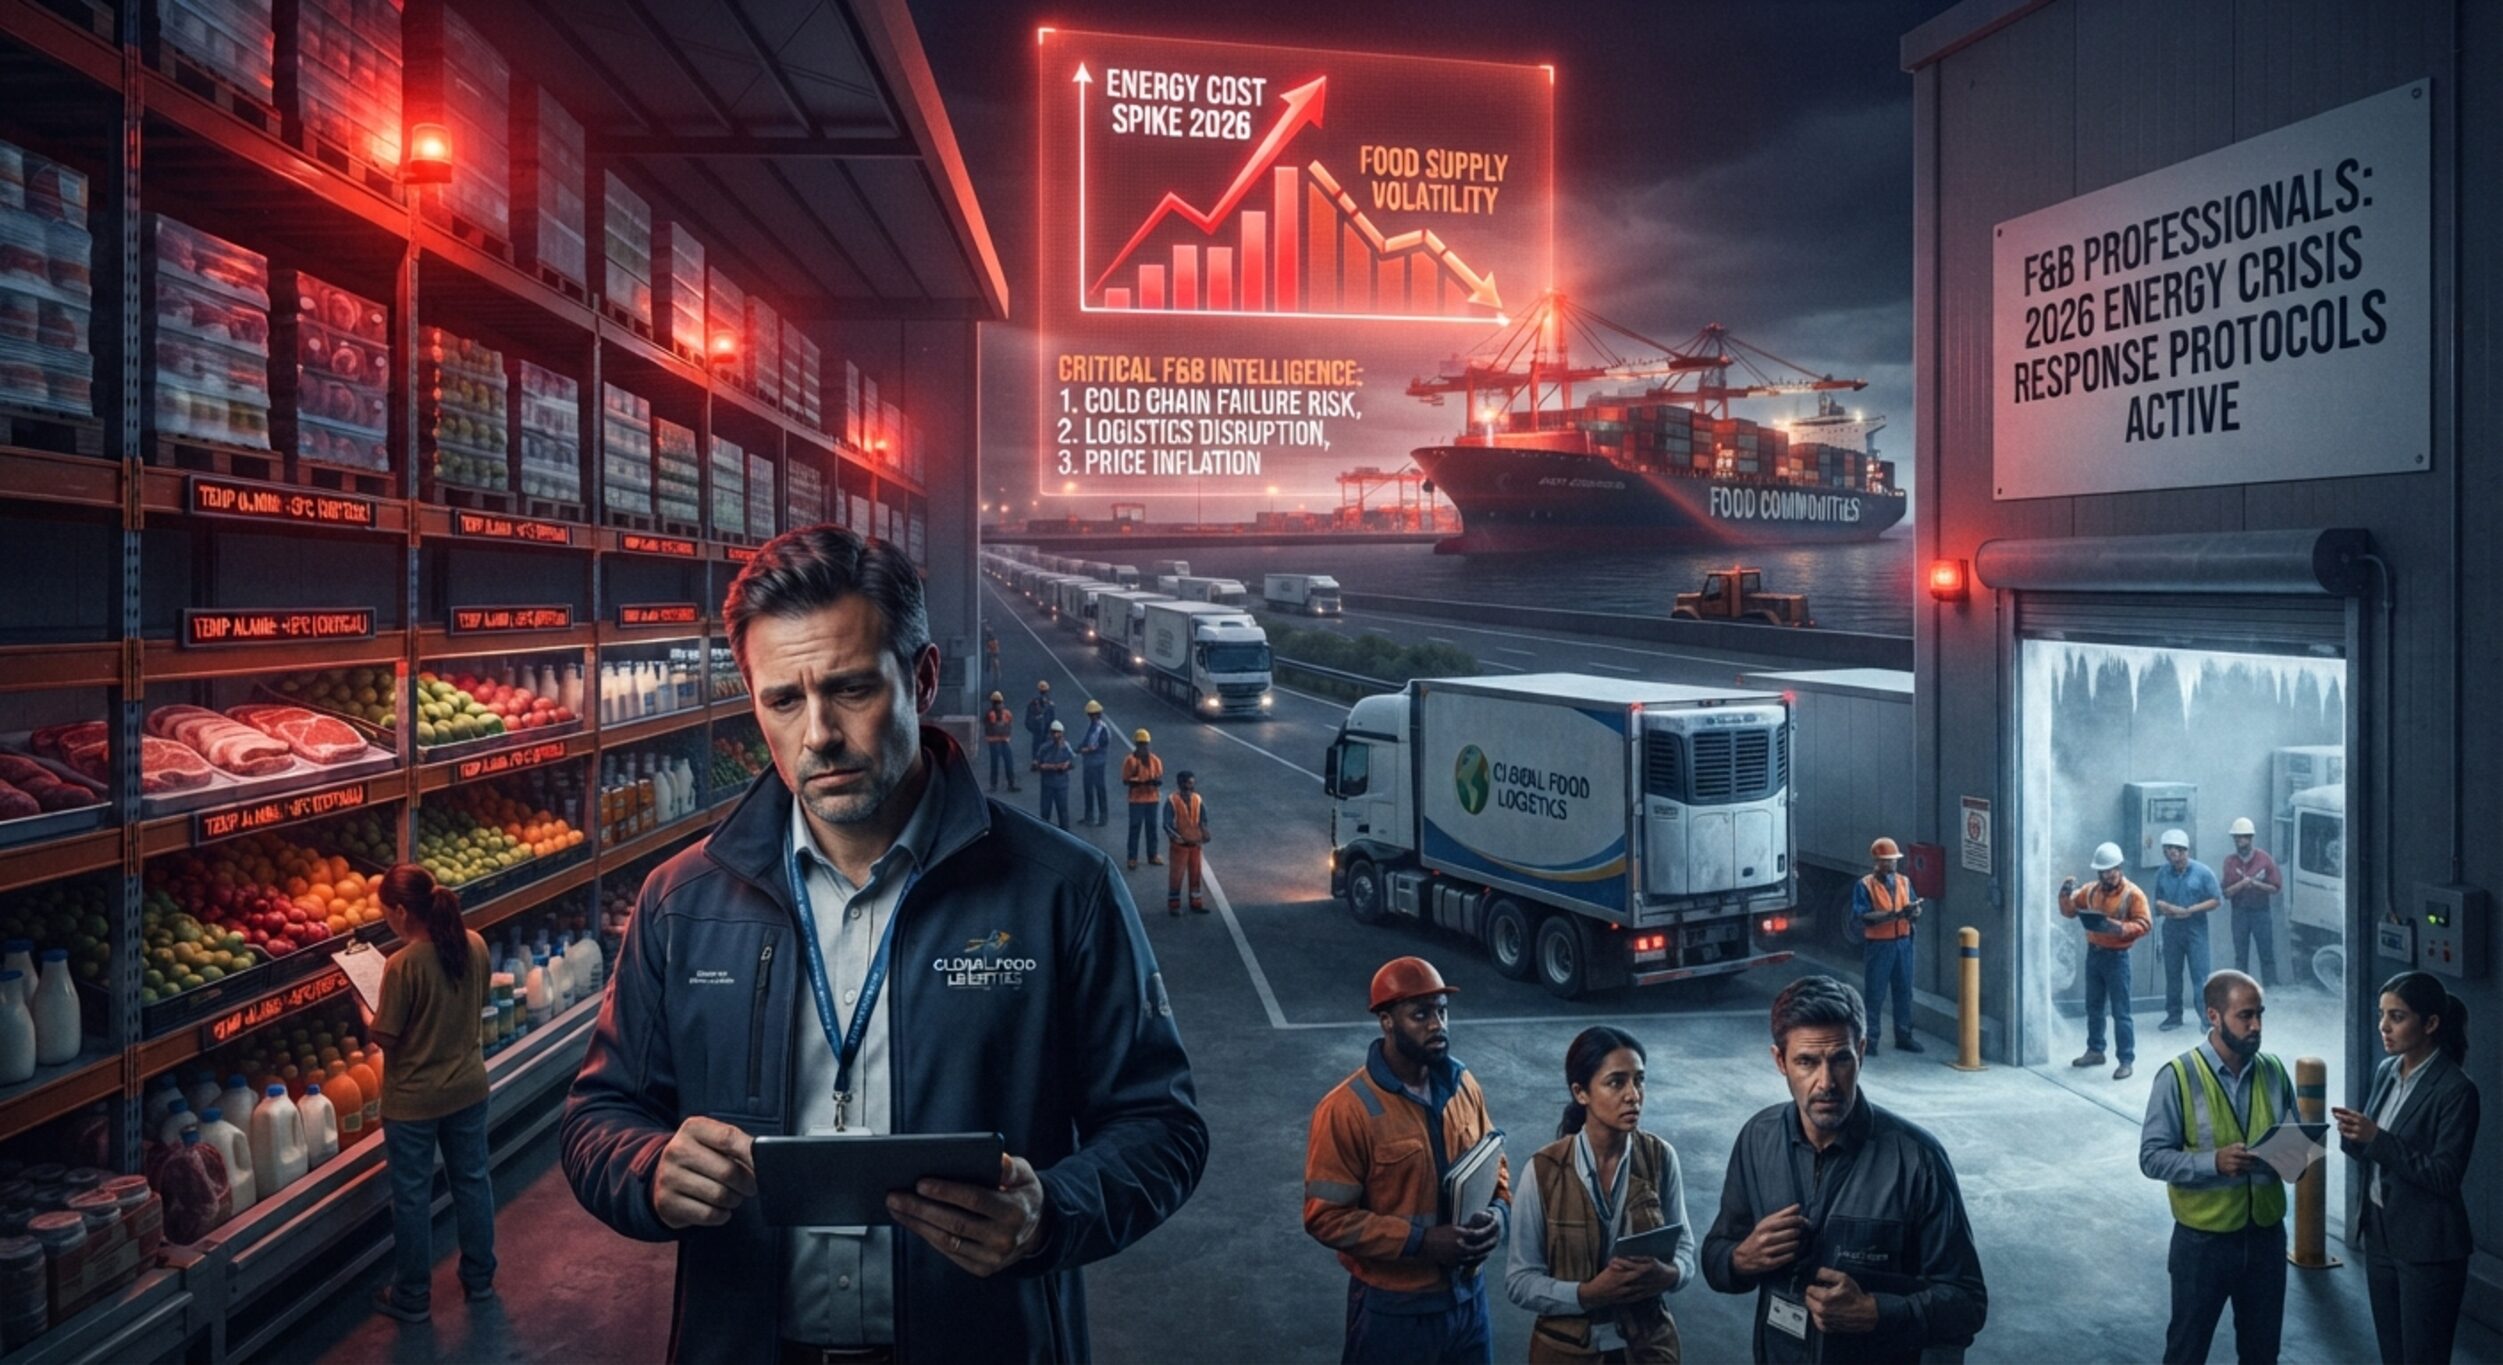

How the 2026 Energy Crisis Is Threatening the Global Food Supply Chain — And What Every F&B Professional Needs to Know Right Now
ESSFeed Special Report | July 2026
Research Sources: Trump G7 Admission, U.S. EIA, IEA, FAO, CFR, Brookings Institution, OECD, World Bank, ABPA
“We run out of reserves in about four weeks. You know, there are reserves all over the world, and we would really run out, and there’ll be a time when you wouldn’t be able to get it. It would be bedlam.” — President Donald Trump, G7 Summit, Évian-les-Bains, France, June 17, 2026
THE ADMISSION THAT CHANGED EVERYTHING
On June 17, 2026, at the G7 Summit in Évian-les-Bains, France, President Donald Trump made one of the most consequential public admissions in modern economic history. The world, he said, was approximately four weeks from running out of commercially accessible oil reserves.
The statement was not hyperbole. It was a candid explanation of why his administration had accepted a Memorandum of Understanding with Iran — a deal that his own officials reportedly opposed — and why the geopolitical calculation had shifted from military escalation to rapid diplomatic resolution.
Speaking at the G7 summit, Trump described the Iran deal as necessary to “avoid an economic catastrophe.” “What this does is it allows the ships to go,” he said. “If we keep bombing, those ships won’t be going.”
The admission stands in direct contradiction to statements Trump made just ten weeks earlier. In a nationally televised address on April 1, 2026, Trump declared: “We’re now totally independent of the Middle East. We are there to help. We don’t have to be there. We don’t need their oil. We don’t need anything they have.”
The gap between April’s declaration and June’s admission at the G7 tells you everything about how rapidly the energy crisis escalated — and how catastrophically close the global food system came to a supply collapse.
This is the story of what happened, why it matters for the food and beverage industry, and what comes next.
PART ONE: HOW THE WORLD GOT TO FOUR WEEKS FROM BEDLAM
The Strait of Hormuz: 20% of Global Oil Through One Narrow Channel
The Strait of Hormuz is a 33-kilometre-wide waterway between Iran and Oman. Through this single chokepoint flows approximately 20% of the world’s oil, significant volumes of liquefied natural gas (LNG), and — critically for food systems — a substantial share of global fertilizer exports from Gulf producers including Iran, Qatar, Saudi Arabia, and the UAE.
Around 20 per cent of global oil consumption, liquified natural gas and key agricultural inputs, including fertilisers, transit through this narrow corridor. Disruptions here are already sending shockwaves around the world, with direct implications for food and water security, especially in import-dependent regions.
When the US-Israeli military campaign against Iran — Operation Epic Fury — disrupted shipping through the Strait, it didn’t just trigger an oil price spike. It created a cascading shock across oil, gas, fertilizer, food logistics, and cold chain distribution simultaneously.
Since the escalation of conflict in late February 2026, maritime traffic has declined dramatically. By mid-March, export volumes had fallen to less than 5 percent of their pre-conflict levels.
This was not a supply disruption. This was a near-total shutdown.
The IEA’s Verdict: Worst Oil Disruption in History
The International Energy Agency characterized this as the “largest supply disruption in the history of the global oil market.” The conflict has echoed the 1970s energy crisis through acute supply shortages, currency volatility, inflation and heightened risks of stagflation and recession.
The strategic petroleum reserve releases attempted to fill the gap. At the start of the war, both the U.S. and other IEA countries announced they would release oil from their strategic reserves, putting 400 million additional barrels onto the market. The Trump administration said it would release 172 million barrels from its strategic reserve over a 120-day period.
It wasn’t enough. Brookings Institution analysts Robin Brooks and Ben Harris argued in a May analysis that emergency stockpile releases and other temporary supply buffers that had so far eased disruptions would be largely exhausted by July 9. Once those buffers disappear, the full extent of the shortage would have become visible to the markets.
OECD Oil Stocks: Lowest Since 2003
Oil inventories held by OECD member countries, including Japan and the United States, are expected to fall to their lowest level since records began in 2003 by the end of 2026, according to a forecast released on June 9th by the U.S. Energy Information Administration. The EIA projects that OECD oil inventories will decline to just under 2.3 billion barrels, equivalent to approximately 50 days of demand, by the end of the year.
Fifty days. That is the buffer between developed-world economies and empty fuel tanks as we enter the second half of 2026.
The EIA also warned: “We assume that the Strait of Hormuz will remain effectively closed into early summer, with flows slowly starting to resume in Q3. If flows resume within this timeframe, we expect it will take until early 2027 for production and trade patterns to generally return to pre-conflict status. And we anticipate that some producers around the Persian Gulf will not be able to bring oil output back to pre-conflict levels before the end of 2027.”
Read that carefully. Even with the MOU signed and Hormuz reopening, the EIA forecasts a full two years before Middle East oil production normalizes. The crisis is not over. It is in its early chapters.
PART TWO: WHY NO OIL MEANS NO FOOD
For most consumers, energy is what powers their car, heats their home, and charges their phone. The connection between oil prices and what they pay at the supermarket is invisible — abstracted away by complex supply chains and decades of cheap energy masking the dependency.
For food and beverage professionals, this abstraction is dangerously misleading. The global food system does not run on good intentions. It runs on oil.
The Six Oil-Food Dependencies
1. Fertilizer: The Most Critical Link
Approximately half of global food production relies on synthetic fertilizers, particularly nitrogen-based inputs such as ammonia and urea. This dependency is structural rather than optional. Fertilizer enables soils to exceed their natural fertility limits, supporting yields that sustain a population of more than eight billion people. In its absence, agricultural output would fall dramatically, not gradually, because modern crop systems are calibrated around high-input, high-yield conditions. Nitrogen fertilizers are produced through the Haber-Bosch process, which relies heavily on natural gas as both a feedstock and an energy source.
The Haber-Bosch process—invented in 1909 and responsible for feeding roughly half the world’s population through nitrogen fertilizer production—requires natural gas as both fuel and feedstock. When natural gas is disrupted, fertilizer production collapses. When fertilizer is disrupted, crop yields collapse. When crop yields collapse, food prices explode.
The fertilizer sector has been even more severely affected by the Hormuz closure than oil. Unlike oil, no globally coordinated strategic reserves exist for fertilizers. The conflict has damaged key production facilities in the Gulf region or forced them to shut down. Major producers in Iran, Qatar, Saudi Arabia, and the United Arab Emirates have reduced or suspended operations.
The consequence was immediate and severe. Fertilizer prices spiked between February and March 2026, with urea prices surging by nearly 46 percent month on month.
FAO’s latest Food Outlook documents a 20 to 25 percent drop in global fertilizer trade volumes between January and April 2026 compared to the same period a year earlier.
A 25% collapse in global fertilizer trade in four months. This is not a price signal. This is a supply shock with consequences that will flow through agricultural output for the next 6–18 months, because crops being planted right now—with reduced or absent fertilizer—will produce lower yields at harvest.
Farmers now face difficult decisions that will shape global food production through 2027. They need to reduce fertilizer use and accept lower yields, shift to alternative crops, or absorb much higher costs and risk financial collapse.
2. Farm Mechanization: Every Tractor, Harvester, and Irrigation Pump
Modern agriculture is mechanized agriculture. Tractors, harvesters, planters, irrigations pumps, grain driers, and refrigerated storage all run on diesel or electricity generated from fossil fuels. Without fuel, fields cannot be planted, crops cannot be harvested, and grain cannot be dried or stored.
By 2026, over 70% of global agricultural output remained directly dependent on fossil fuel inputs, whether through mechanization, fertilizer synthesis, transport logistics, or storage infrastructure.
This is not a developing-world problem. US, EU, Australian, and Brazilian agriculture is equally dependent on diesel-powered mechanization. Fuel rationing or price spikes create immediate operational constraints for large-scale farming operations with thin margins.
3. Food Transportation: Every Truck, Ship, and Plane
Global food trade is oil-powered. Container ships run on heavy fuel oil (bunker fuel). Refrigerated trucks run on diesel. Air freight—the backbone of fresh produce, seafood, and high-value food trade—runs on jet fuel.
If shipping through Hormuz is disrupted, the impact can be felt in Europe, Asia, the US, and emerging markets. Oil prices usually move first. Gas markets then follow, pushing higher. Shipping and insurance costs can also increase. Over time, the higher cost of energy starts feeding into other parts of the economy.
The Red Sea alternative routing—ships going around South Africa’s Cape of Good Hope instead of through the Suez Canal—adds 8–14 days to Europe-Asia voyages and increases fuel consumption by 25–30%. Higher fuel costs + longer routes = dramatically higher food freight costs.
4. Cold Chain: The Invisible Backbone of Food Safety
Refrigeration is the food safety system that prevents protein spoilage, extends shelf life, and enables the global trade of perishable products. Cold chain facilities—refrigerated warehouses, refrigerated trucks, port reefer infrastructure—consume massive amounts of electricity and diesel.
Energy price spikes translate directly into cold chain cost increases. For proteins (meat, dairy, seafood), produce, and prepared foods, cold chain costs represent 15–25% of delivered cost. A 30–40% energy price increase translates to 5–10% total cost increase in perishable food delivery—absorbed by either the supplier or the consumer.
5. Packaging: Plastics Are Petrochemicals
Food packaging is petrochemical-derived. Flexible plastics (polyethylene film, polypropylene, PET), rigid plastics (HDPE containers, PET bottles), foam trays, and food-grade coatings all require crude oil or natural gas as feedstocks.
Fertilizers (urea and ammonia) are also affected, and lacking fertilizers spill over into reduced agricultural output. Roughly a third of the world’s methanol production is also affected, and methanol is an important feedstock for plastics.
When crude oil prices rise, plastic packaging costs rise. When natural gas is disrupted, packaging film production contracts. This is not a hypothetical—during the 2022 energy crisis, packaging lead times extended to 12–16 weeks and prices rose 40–60% for some categories.
6. Food Processing: Every Oven, Dryer, and Production Line
Food manufacturing is energy-intensive. Baking, cooking, pasteurization, drying, grinding, and refining all require heat—typically from natural gas. Bottling, packaging, and cold storage require electricity. A food processing facility running 24/7 has energy as one of its top three cost inputs alongside ingredients and labor.
Energy cost increases of 30–50% (as seen in early 2026) translate directly into processor margin compression or retail price increases passed to consumers.
PART THREE: THE FERTILIZER TIME BOMB — CROPS PLANTED NOW HARVEST LATER
The most underreported dimension of the 2026 oil crisis is its delayed effect on food production. Oil price spikes are immediate and visible. Fertilizer supply disruptions are invisible—until harvest.
When a farmer reduces fertilizer application (because prices are too high or supply is unavailable), crop yields decline 3–6 months later at harvest. The yield reduction is not hypothetical or speculative. It is agronomically predictable.
The FAO warned that a prolonged crisis in the strait could lead to a global food catastrophe due to rising oil prices and disruptions to the fertilizer supply chain. A top United Nations official said the closure of the strait was creating a crisis in the agricultural industry in Asia and Africa. According to the FAO, India, Bangladesh, Sri Lanka, Somalia, Sudan, Tanzania, Kenya and Egypt are among the countries most at risk.
A supplementary analysis in the OECD-FAO Agricultural Outlook 2026-2035 suggests that disruptions associated with the 2026 Middle East conflict will constrain fertiliser use and as a result cereal production, especially in low-income countries.
Aggregate global cereal output is forecast to decline by 2.0 percent in 2026 from the previous year to 2 982 million tonnes, while utilization is expected to continue to grow, with a 1.0 percent increase in output used for human consumption.
A 2% production decline against 1% demand growth is a structural tightening of global food stocks. On a base of 3 billion tonnes, 2% represents approximately 60 million tonnes of missing food output. At a time when 52 million people in West and Central Africa alone are already projected to be acutely food insecure, this is a catastrophic margin of error.
The Countries Most Exposed
The FAO identifies import-dependent nations with limited fertilizer buffer stocks as most immediately at risk. These include countries across:
- East and Southern Africa (87 million people already facing acute hunger)
- South Asia (Bangladesh, Sri Lanka, India import significant fertilizer from Gulf producers)
- North Africa and the Middle East (Egypt’s wheat import dependency; MENA food security heavily reliant on Black Sea and Gulf shipping)
- Southeast Asia (Vietnam, Philippines, Indonesia import significant energy and fertilizer through affected routes)
But the fertilizer disruption doesn’t stop at developing-world borders. European agriculture—which draws heavily on Gulf-sourced urea and ammonia—faces elevated input costs that will squeeze farm margins and eventually retail prices in Q3–Q4 2026.
PART FOUR: WHERE ARE WE NOW — THE MOU AND WHAT IT DID (AND DIDN’T) FIX
The US-Iran Memorandum of Understanding, signed June 18, 2026, created a ceasefire in the conflict that had disrupted Hormuz shipping. The MOU was not a peace treaty. It was a pause—a 60-day window to negotiate before military escalation resumed.
By July 10, oil benchmark prices hovered near $71 per barrel as energy markets remained optimistic. There was a quick pivot in early July to a potential global oil glut—the same oil industry fear that existed early this year before the war—with production volumes rising in the Americas and now rebounding in the Middle East.
The market’s optimism is understandable. But the underlying structural damage to supply chains, reserves, and fertilizer production hasn’t been repaired.
The U.S. Strategic Petroleum Reserve is now at its lowest level since 1983, holding just over 300 million barrels of crude—significantly depleted from its pre-conflict levels.
Today, crude prices have risen again. As of July 23, 2026, Brent Crude sits at $98.67/barrel—driven by fresh Houthi attacks on Saudi oil tankers and escalating Russia-Ukraine Black Sea grain port disruptions. The geopolitical risk premium that briefly deflated in early July is back, and it’s climbing.
The EIA’s projection of OECD oil inventories reaching 50-day cover by year-end assumes a relatively smooth Hormuz reopening. If geopolitical tensions resurface—as current market data suggests they are—the 50-day projection could tighten further.
PART FIVE: FOOD PRICE TRAJECTORY — WHAT THE DATA SAYS
Global food prices have so far been partially buffered by strategic reserve releases, government subsidy programs, and early-season harvest optimism. But forward indicators are deteriorating.
Grains: Corn at $4.88/bu (+15% from June 30 lows), wheat at $7.05+/bu (highest since July 2023), soybeans near 2.5-year highs. These rallies began before the current Houthi escalation; they will accelerate if Black Sea shipping disruption intensifies.
Fertilizer: Urea prices surged 46% in a single month (February–March 2026). Even with partial Hormuz recovery, fertilizer supply chains will remain disrupted through H2 2026 as production facilities restart (which takes months, not weeks).
Shipping: Red Sea alternative routing adds $800–$1,500 per container in extra fuel and time costs. These costs are embedded in every imported food product reaching European, US, and Asian markets.
Energy inputs to processing: Industrial gas prices, used in food manufacturing and processing, remain elevated 35–55% above pre-conflict levels in European markets. US natural gas (Henry Hub) at $3.70/MMBtu is at the high end of its recent range.
The World Food Programme estimates that the conflict could potentially push 45 million additional people into acute hunger.
Forty-five million people. The food system’s safety net—already strained by COVID-era disruption, the 2022 Ukraine war, and post-pandemic inflation—is facing its most severe structural stress in 50 years.
PART SIX: WHAT THIS MEANS FOR FOOD & BEVERAGE PROFESSIONALS
For Food Manufacturers
Immediate: Review energy cost exposure across manufacturing facilities. Natural gas contracts, electricity tariffs, and diesel fuel costs require immediate audit against current market rates. Facilities without fixed-rate energy contracts are exposed to spot pricing that remains 30–55% above pre-crisis levels.
Short-term: Fertilizer price increases will flow through to grain, oilseed, and produce prices in Q3–Q4 2026 as reduced-fertilizer crops come to harvest. Lock grain procurement now (corn, wheat, soybeans) at current levels before harvest data confirms yield reductions.
Strategic: Evaluate energy efficiency investments (biogas, solar thermal, heat recovery) as permanent cost reduction measures. The energy transition is no longer a sustainability choice; it’s a margin protection necessity.
For Foodservice Operators
Menu engineering: The oil crisis is accelerating beef-to-poultry substitution (covered in our main issue today). Brazilian chicken is filling the global protein gap left by high beef prices—itself driven partly by elevated feed and production energy costs. Build menus around chicken, pork, and plant proteins that can absorb energy cost volatility better than beef.
Supply chain resilience: Cold chain disruption risk is real. Refrigerated transport and warehouse costs will remain elevated. Work with logistics partners on surcharge transparency and explore nearshoring of supply where feasible.
Energy management: Restaurant operators should review our earlier feature on cutting energy costs 25–40%—the strategies outlined (demand charge management, LED, battery storage) have never been more relevant. Every dollar saved on energy is a dollar that doesn’t require menu price increases.
For Retail Buyers and Category Managers
Protein category: Beef remains under dual pressure—supply tightness AND energy-intensive production costs. Poultry (especially from Brazil) offers volume and price advantages. Expand chicken SKU depth and front-of-store positioning.
Shelf price strategy: Retailers are caught between manufacturer cost increases and consumer price elasticity. The grain, packaging, and transport cost increases flowing through H2 2026 will create renewed rounds of price increase requests. Evaluate total supplier economics (not just unit prices) before negotiating.
Private label: This is the moment to accelerate private-label development in energy-sensitive categories. Consumer trade-down from branded to private label accelerates during inflationary periods—retailers who have invested in private-label quality capture this trade-down rather than losing the sale.
For Supply Chain and Logistics Teams
Route diversification: Any supply chain dependent on Hormuz-adjacent routing (Gulf produce, Asian seafood, Middle Eastern dairy) requires immediate contingency routing analysis. Cape of Good Hope alternatives exist but cost more.
Inventory strategy: 50-day OECD oil cover by year-end suggests potential Q4 supply shock risk. Consider modest inventory buffer building in critical ingredients where storage is feasible.
Freight contracts: Spot freight rates are volatile. Lock carrier rates where possible through Q1 2027. Carriers are increasingly pricing in geopolitical risk premiums for Middle East routing.
CONCLUSION: THE STRUCTURAL FRAGILITY HAS BEEN EXPOSED
The 2026 oil crisis is not a temporary disruption that will resolve cleanly and return to normal. It has exposed a structural fragility in the global food system that three decades of cheap energy masked entirely.
Modern food production is inextricably linked to fossil fuel energy. Every tonne of grain produced, every container of protein shipped, every refrigerated truck delivering produce, every packaging film wrapped around a food product—all of it runs on oil and gas. The food system’s dependency on energy is not a design flaw; it’s a design feature that enabled eight billion people to be fed. But design features become vulnerabilities when the underlying assumption (cheap, abundant energy) no longer holds.
Trump’s G7 admission—”it would be bedlam”—was actually a moment of rare clarity about what underpins the global economy. The food system sits at the bottom of the energy dependency stack. When energy goes, food goes with it.
The immediate crisis has been partially stabilized by the MOU and Hormuz reopening. But the SPR is at 1983 levels. Fertilizer supply chains are disrupted for H2 2026 at minimum. Grain prices are rallying on weather and war risk simultaneously. And geopolitical tensions are rising again as Houthi attacks resume.
For food and beverage professionals, the message is direct: this crisis is not over, the structural vulnerabilities it exposed are real, and the companies that treat 2026’s energy disruption as a temporary anomaly rather than a preview of a new operating environment are taking a significant strategic risk.
The companies that win from here are those that hedge energy costs, diversify supply chains, accelerate efficiency investments, and position their procurement strategies for a world where energy is expensive, supply chains are fragile, and “bedlam” is a word that gets used in G7 summits.
SOURCES
| Source | URL | Details |
|---|---|---|
| Trump G7 Statement | https://www.thehill.com | “We run out of reserves in about four weeks”; June 17, 2026 |
| IBTimes UK | https://www.ibtimes.co.uk | Trump G7 full context; April 1 independence claim; MOU details |
| National Security Journal | https://nationalsecurityjournal.org | Brookings analysis; July 9 buffer exhaustion date; full Trump quote |
| ICIS / Chemicals & Economy | https://www.icis.com | EIA Hormuz timeline; production restart projections; 2027 normalization |
| EIA (U.S. Energy Information Admin) | https://www.eia.gov | OECD oil stock projections; 50-day cover by year-end; June 9 report |
| IEA | https://www.iea.gov | “Largest supply disruption in history” characterization; reserve releases |
| Fortune | https://fortune.com | SPR at lowest since 1983; July 10 oil market analysis |
| Council on Foreign Relations | https://www.cfr.org | FAO Chief Economist Torero Cullen analysis; fertilizer shock; June 3, 2026 |
| FAO Food Outlook | https://www.fao.org | 20-25% fertilizer trade decline; cereal production forecast; June 2026 |
| FAO Agrifood Policy | https://www.fao.org | Urea prices +46% month-on-month; government subsidy interventions; April 2026 |
| OECD-FAO Agricultural Outlook 2026-2035 | https://www.oecd.org | Fertilizer constraint on cereal production; 10-year food market outlook |
| World Bank / WFP | https://thedocs.worldbank.org | 45 million additional people at risk of acute hunger; March 2026 |
| SDG2 Advocacy Hub | https://sdg2advocacyhub.org | Hormuz chokepoint; 50+ countries at risk; coordinated response urgency |
| OilPrice.com | https://oilprice.com | Fertilizer shock; Gulf production suspension; May 2026 |
| Democracy Now / Prof. Adam Hanieh | https://www.democracynow.org | Gulf fertilizer diversification; wealthier-country fertilizer diversion; April 2026 |
| LAT London | https://www.lat.london | Energy-food linkage analysis; 2026 shock vs. 2022 Ukraine crisis comparison |
| Fair Observer | https://www.fairobserver.com | Haber-Bosch process dependency; nitrogen fertilizer structural analysis |
| Werner Antweiler / UBC | https://wernerantweiler.ca | Oil shock scale analysis; methanol/plastics implications; April 2026 |
ESSFeed Special Report. All data verified through primary sources. Next energy/food security update: August 2026.