
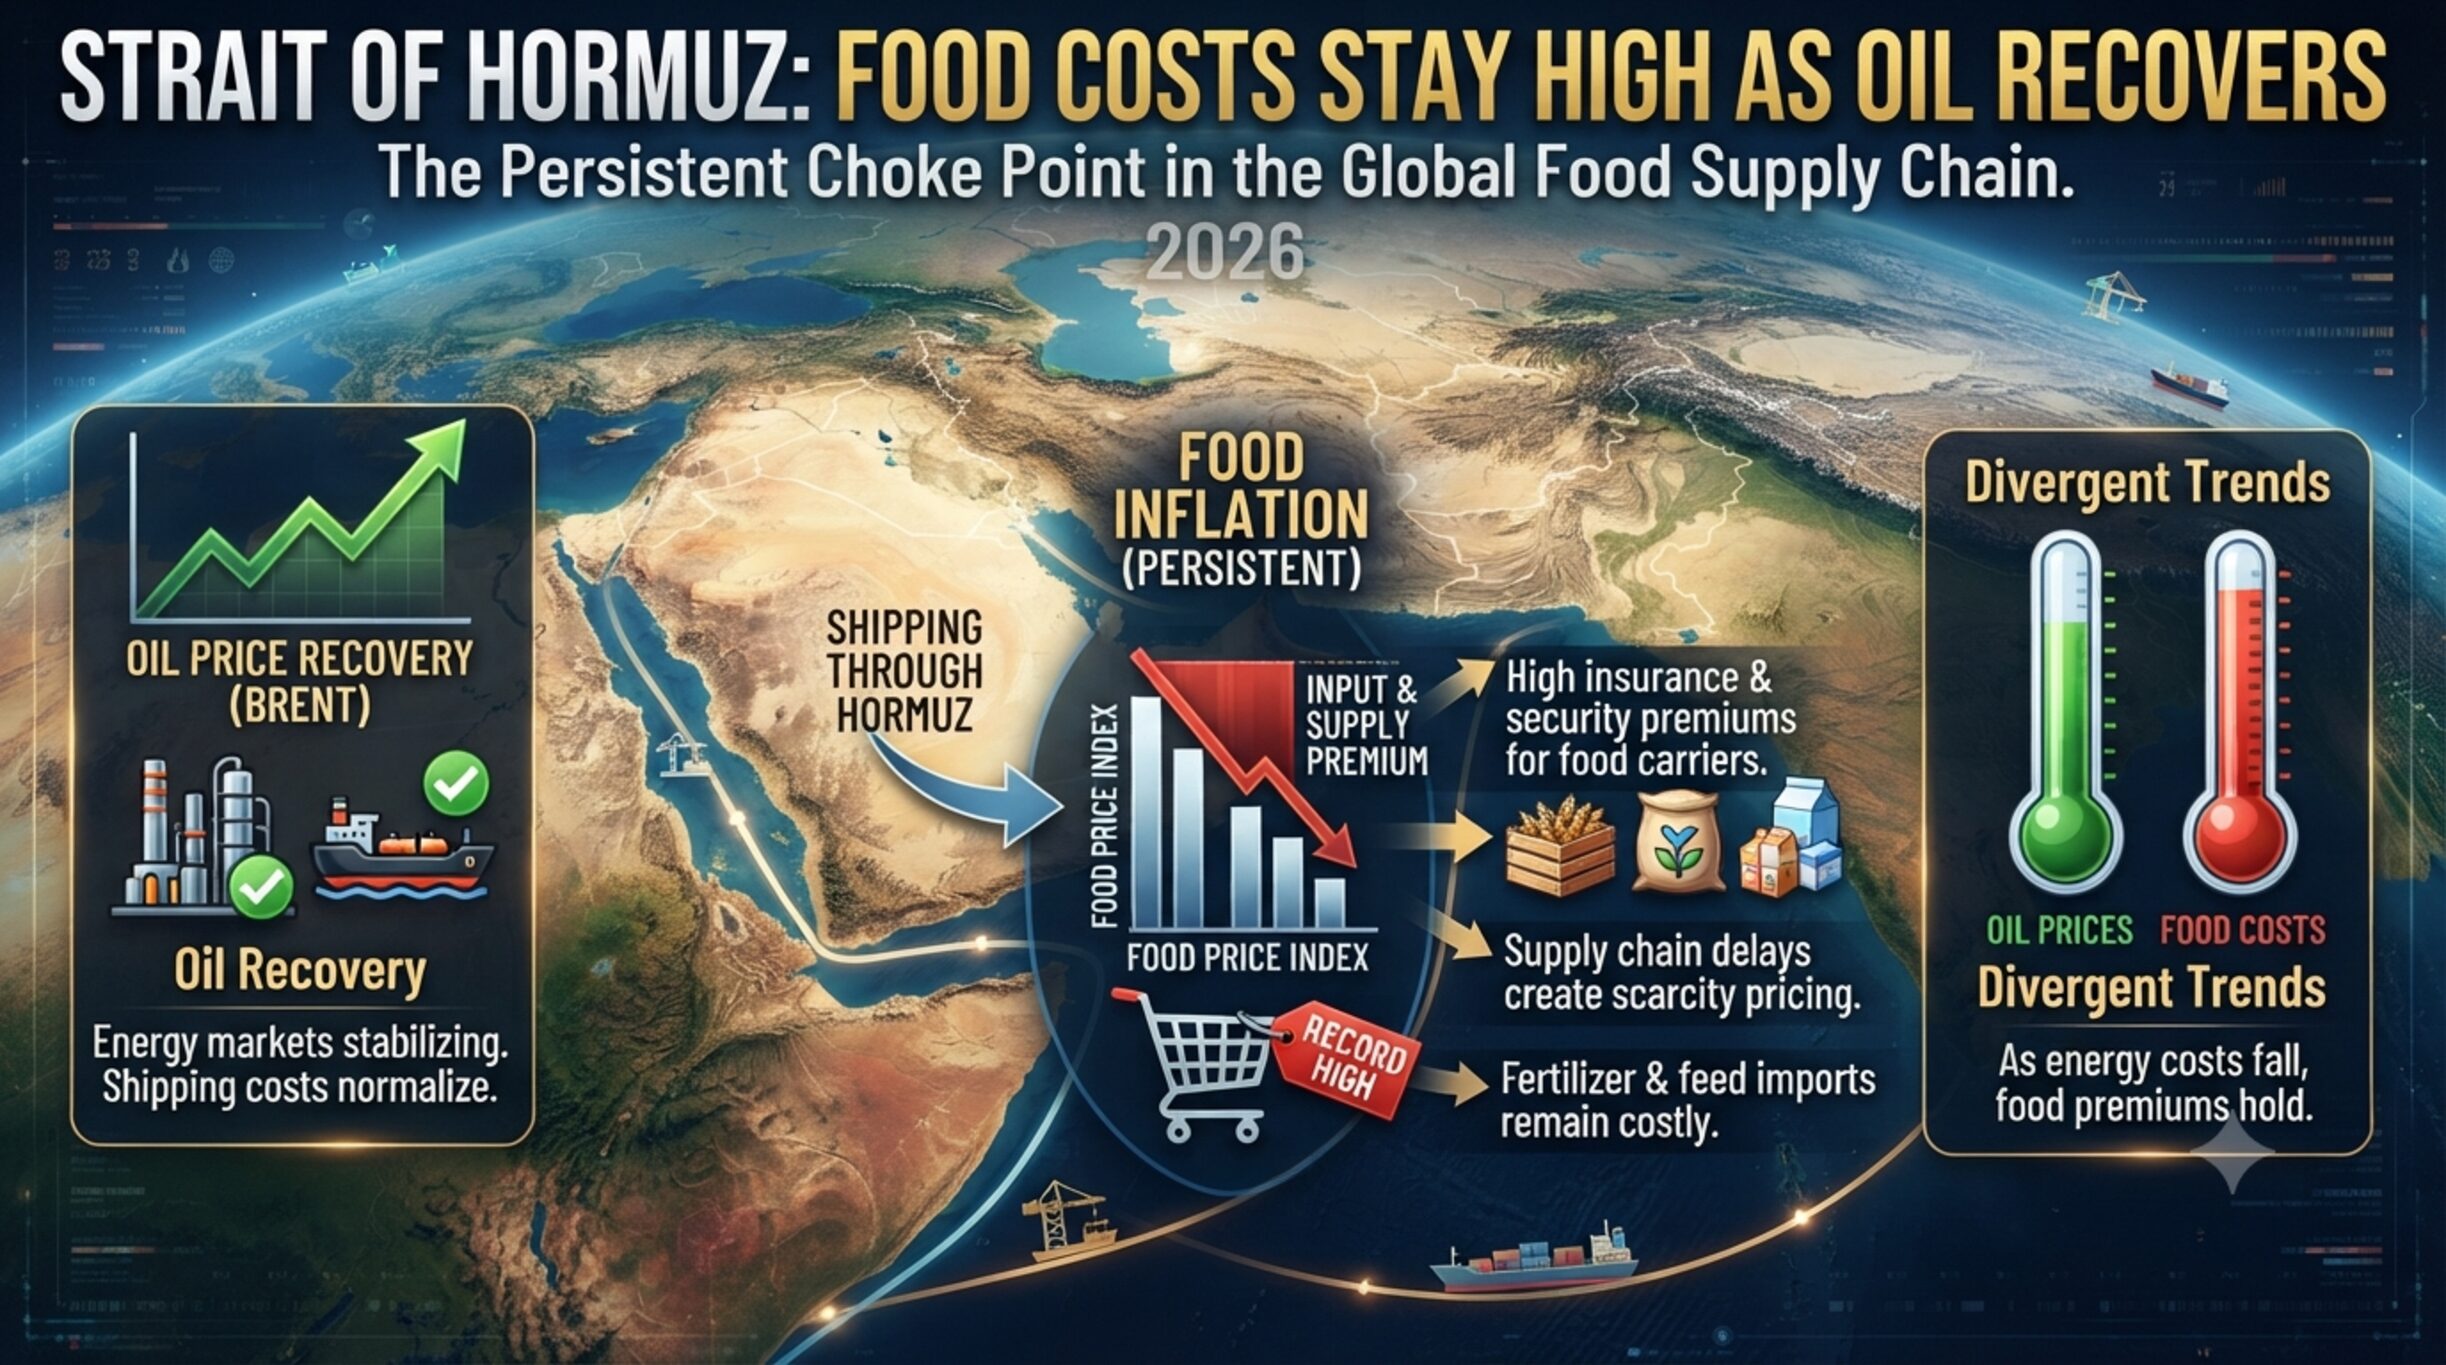
Oil is back to pre-conflict levels but grain freight and fertilizer costs are not. What the Strait of Hormuz shock still means for food buyers.
The headline numbers say the crisis is over. Crude is trading roughly where it sat before hostilities began, urea has retraced almost its entire spike, and the FAO Food Price Index has barely moved. On that evidence, the Strait of Hormuz disruption looks like a shock that came and went.
It is not that simple. The cost has not disappeared — it has migrated. It sits in freight rates that are falling far more slowly than energy did, and, more consequentially, in planting decisions that were made during the expensive months and will not show up in supply until 2027. For anyone buying agricultural commodities forward, the interesting question is no longer what the disruption did to prices in the spring. It is what it did to the next crop.
Table of Contents
The shock, and what has actually recovered
Hostilities beginning on 28 February 2026 effectively closed one of the world’s most important maritime chokepoints. UNCTAD data shows transits falling from roughly 125 a day between 1 January and 27 February to around 10 a day from 28 February through 14 June — a 92% reduction.
Recovery has been partial. Transits reached about 40 on 2 June and averaged near 60 in the days following a Memorandum of Understanding signed by US and Iranian delegations. That is roughly half pre-conflict throughput, and negotiations toward fuller restoration were still under way.
The operational damage during the acute phase was severe. More than 1,550 vessels were stranded in or near the Gulf at one point, with an estimated 22,500 mariners caught up in it. Carriers rerouted around the Cape of Good Hope, adding 3,500 to 4,000 nautical miles and 10 to 14 days to voyages. Dun & Bradstreet identified more than 44,000 businesses across 174 economies with at least one exposed shipment as of 12 March, with wholesale trade the single most affected sector at over 27% of impacted businesses and transportation services next at 18%.
Energy, though, behaved exactly as energy usually does. Crude jumped to $120 per barrel, averaged around $100 through the conflict, and has since fallen back to roughly $70 — essentially pre-conflict levels. Energy markets clear quickly because the underlying commodity is fungible and inventories are deep.
Freight is where the cost is still sitting
Shipping does not clear that quickly, because the constraint is physical capacity and time, not molecules.
The International Grains Council’s Grains and Oilseeds Freight Index — which tracks seaborne freight costs for wheat, corn, barley, sorghum, soybeans, rapeseed and sunflower seed across 68 exporting origins in the US, EU, Canada, the Black Sea, Brazil, Australia and Argentina — rose to approximately 190 during the conflict. That is 90% above its 2013 base and 30% above where it stood when hostilities began. It has been declining only slowly since.
At the peak, ocean freight spot rates on affected routes ran three to four times pre-conflict levels, with US importers seeing increases of up to 50%. War risk insurance premiums and bunker fuel costs compounded the effect, and one major forwarder publicly advised clients to plan for four to six months of elevated costs and delays.
This matters more for food than for most cargo categories, because agricultural commodities are low-value-per-tonne. A freight increase that is a rounding error on electronics is a material share of landed cost on bulk grain. UNCTAD’s framing is worth stating plainly: this is a chain in which limited transit raises energy and fertilizer costs, which raise transport costs, which raise agricultural production costs, which eventually reach domestic food prices.
Fertilizer: prices normalised, planting decisions did not
Roughly one-third of global seaborne fertilizer trade — about 16 million tonnes — moves through the strait, and Gulf producers account for around a quarter of global urea exports.
The price response was violent. Urea moved from around $400 per tonne to above $850 in April, the highest since April 2022, before falling back to $453 by June. The World Bank recorded a 53.7% month-on-month jump to $725.60 in March alone. DAP climbed from roughly $580 to around $770 per tonne. The supply side broke in several places at once: Iran halted ammonia production, Qatar suspended urea, ammonia and sulfur output after damage to facilities, and India cut production on reduced LNG availability. In Egypt, urea rose 28% within days to $625 per tonne, with previously negotiated contracts cancelled under force majeure and buyers pushed into spot.
On price alone, that story has largely resolved. The problem is that fertilizer is bought and applied on a calendar, not a spot basis — and the spike landed squarely on the Northern Hemisphere spring planting window.
US retail data illustrates the squeeze. By mid-April, anhydrous ammonia averaged $1,114 per ton, UAN32 $579 and UAN28 $520, up 29.2%, 24.5% and 26.2% respectively from mid-February, and up 42.6%, 29.2% and 36.8% year on year. At typical application rates that translated to roughly $49 to $54 per acre on urea and $32 to $39 per acre on UAN. A ceasefire brought no immediate relief — prices rose again in the first full week after the announcement. The US draws around 17% of its urea consumption and 20% of DAP/MAP from the Persian Gulf.
The consequence is a substitution effect that outlives the price spike. FAO has explicitly linked expectations of reduced 2026 wheat plantings to growers shifting toward less fertilizer-intensive crops.
Food prices are calm — and that is the misleading part
The FAO Food Price Index averaged 130.3 points in June, down 0.3% from May, up 1.7% year on year and still 18.7% below its March 2022 peak. The Cereal Price Index fell 3.5% to 110.2, with wheat down 4.4% and maize down 6.2% on strong Black Sea harvest progress and ample South American supply. Vegetable oils were the outlier, up 7% in June and 23.3% above a year earlier.
FAO’s own explanation for the calm is the important part: cereal prices have risen only moderately because stocks are strong and supplies adequate from previous seasons. Global cereal production for 2025 was put at 3,040 million tonnes, up 6.0%. In other words, the buffer absorbed the shock. FAO’s chief economist has been explicit that the input-side effects of the disruption have not yet transmitted into production and supply.
That buffer is finite. The 2026 wheat forecast has already been revised down to 817 million tonnes, a decline of around 2%, though still above the five-year average. If reduced plantings and lighter fertilizer application produce a weaker 2026/27 crop, the shock arrives in prices roughly a year after it arrived in the news.
The distributional picture deserves noting for anyone selling into emerging markets: UNCTAD identifies 61 vulnerable economies exposed to the combined oil and cereal import price shock, comprising 35 least developed countries and 26 small island states. Cabo Verde’s net oil and petroleum imports have averaged 24.6% of GDP; Yemen’s net cereal imports 10.8%.
What this means for buyers and procurement teams
Do not read the calm spot market as an all-clear on 2027. The most valuable thing in this data set is the gap between what prices are doing now and what planting decisions imply. Buyers with the ability to take forward cover on wheat and other fertilizer-intensive crops into the 2026/27 season are looking at an unusually asymmetric setup: current prices reflect an ample old crop, while the input signal points the other way.
Check whether your freight assumptions have been updated since February. Energy costs have normalised and fertilizer has largely retraced, which makes it easy to assume freight has too. It has not. Landed-cost models built on pre-conflict freight, or on the assumption that rates track crude, will understate cost on bulk agricultural cargo.
Re-examine force majeure and price-adjustment clauses. The Egyptian urea episode — contracts cancelled under force majeure, buyers forced into a spiking spot market — is the practical risk in a supply shock of this type. Contracts written before February may not allocate that risk the way you assumed.
Watch the transit recovery rate, not the ceasefire headline. Throughput at roughly half pre-conflict levels is the operative constraint. Until daily transits return toward 125, capacity remains tight and rates remain supported regardless of the diplomatic position.
Diversify origin on nitrogen-intensive inputs where contract structure allows. Gulf concentration in urea and ammonia is the structural exposure the episode revealed. It has not changed, and the World Bank has flagged upside risk to fertilizer prices if disruption persists.
Related
Frequently asked questions
Is the Strait of Hormuz open again?
Partially. Transits recovered from a low of around 10 per day during the conflict to roughly 60 per day following a Memorandum of Understanding between US and Iranian delegations — approximately half of pre-conflict levels of about 125 daily. Negotiations toward fuller restoration have been under way.
Why have food prices stayed stable if input costs spiked?
Because global cereal stocks entering the disruption were strong, with 2025 production up 6% at 3,040 million tonnes. FAO has stated that input-side cost increases have not yet transmitted into production and supply. The effect is expected to appear through the next harvest rather than immediately.
Which agricultural inputs were most affected?
Nitrogen fertilizers. Roughly one-third of seaborne fertilizer trade passes through the strait and Gulf producers supply around a quarter of global urea exports. Urea more than doubled from about $400 to over $850 per tonne before retracing to $453 in June. Phosphates rose more moderately, and potash exposure to the route is limited.
Sources
- UN Trade and Development (UNCTAD) — Strait of Hormuz disruption analysis and vulnerable economy assessment
- International Grains Council — Grains and Oilseeds Freight Index
- World Trade Organization — Strait of Hormuz Trade Tracker and fertilizer trade data blog
- FAO — Food Price Index, June 2026, and cereal supply and demand assessments
- World Bank — Commodity Markets Outlook, April 2026, and fertilizer price commentary
- farmdoc daily, University of Illinois — US retail fertilizer price and per-acre cost analysis
- Dun & Bradstreet — container booking exposure data
- Inter Press Service UN Bureau — reporting on UNCTAD findings, July 2026

