
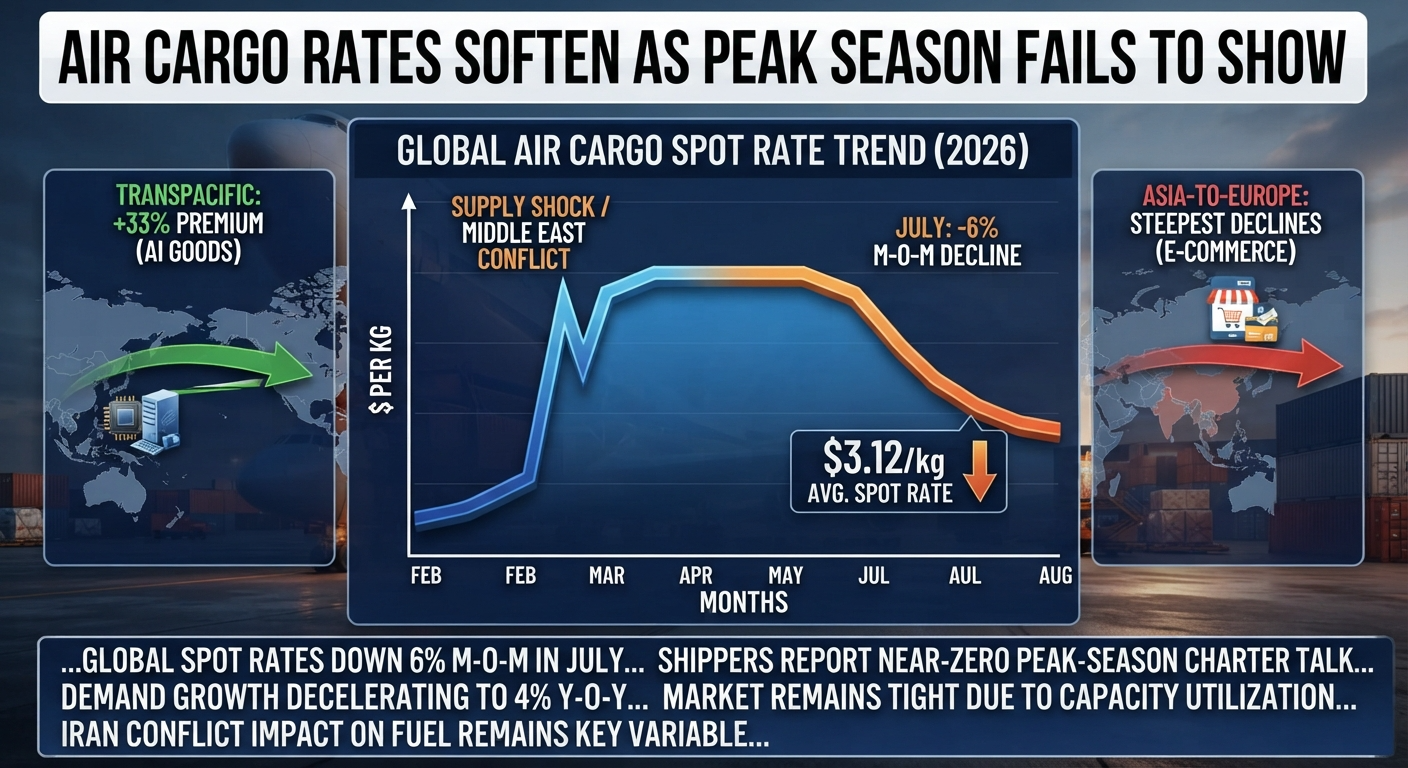

Global air cargo spot rates fell 6% month over month in July, and shippers report almost no talk of peak-season charters heading into H2.
A Peak Season That Isn’t Showing Up
Global air cargo spot rates averaged $3.12 per kilogram in July, still 28% above year-ago levels but down 6% from June, according to freight rate analytics firm Xeneta. More telling than the monthly dip is what isn’t happening around it: the analytics firm’s chief airfreight officer reported that in nearly every conversation with the shipper community heading into the traditional Q3/Q4 peak, only one mentioned interest in booking peak-season charters. That near-total absence of charter demand is now the clearest signal the firm is pointing to for a softer second half of 2026.
The rate trajectory itself tells a story of premiums built during a supply shock now slowly draining away. Year-over-year spot rate growth has eased for two straight months, from a 41% peak in May to 38% in June to 28% in July, tracking a gradual unwind of the price spike that followed capacity disruption tied to the Middle East conflict in late February. But the decline is proceeding in increments rather than a sharp correction. Airlines built pricing power during the supply shock and have strong incentive to defend it, meaning rates are more likely to erode gradually than snap back to pre-conflict levels.
What’s Still Propping Rates Up, and What’s Pulling Them Down
Not every lane is moving the same direction. Transpacific routes remain the market’s strongest, with spot rates from both Northeast Asia and Southeast Asia to North America still running 33% above late-February levels, largely on the back of continued demand for AI-related goods, including semiconductors and computing hardware. That said, even this segment has cooled somewhat from the roughly 41% to 42% premiums recorded at the end of June, suggesting the AI-driven demand surge, while still elevated, has passed its steepest growth phase.
Other corridors are moving in the opposite direction and faster. Europe-to-North America spot rates have fallen 27% below late-February levels, helped along by ample belly-hold capacity from summer passenger schedules. The Asia-Europe corridor has been the weakest of all, with Northeast Asia to Europe rates down 13% month over month and China to Western Europe down 22% to roughly $4.15 per kilogram. That decline lines up closely with the European Union’s removal of its €150 duty-free threshold for low-value imports, a customs change that appears to be curbing the e-commerce-driven air cargo volumes that had been flowing out of China.
Overall demand growth is also decelerating. Global air cargo volumes rose 4% year over year in July, down from an 8% increase in June, while capacity has continued recovering from the Middle East-related disruption. Xeneta’s dynamic load factor measure, which tracks capacity utilization based on cargo volume and weight against available space, rose two percentage points year over year to 61%, indicating the market remains reasonably tight even as growth slows.
Why the Iran Conflict Still Matters to the Rate Curve
The current rate cycle traces directly back to the escalation of the Middle East conflict on February 28, which removed roughly 12% of global air cargo capacity overnight and pushed combined spot and long-term rates up 17% year over year in the first half of 2026. That capacity shock was severe enough that Xeneta reversed an earlier forecast calling for rates to decline 5% to 10% in 2026, instead now projecting a 5% to 15% increase for the full year. With the conflict still unresolved, ongoing fuel price volatility remains a live variable in how quickly, or slowly, rates continue to normalize. As Xeneta’s chief airfreight officer put it, the descent will likely come in small steps rather than the sharp jumps shippers experienced on the way up.
Buyer and Procurement Implications
For shippers negotiating air freight contracts into H2, the data supports a measured approach rather than an aggressive push for immediate rate relief. Airlines have clear incentive to slow-walk rate declines after a period of outsized pricing power, so procurement teams should expect gradual easing on most lanes rather than a return to pre-conflict pricing this year. The China-to-Europe corridor stands out as the one lane where a structural shift, driven by the EU’s customs change rather than pure supply and demand, may keep pulling rates down faster than elsewhere, making it worth renegotiating those contracts sooner rather than waiting for a broader market correction. On the Transpacific lane, shippers moving semiconductor, electronics, or other AI-adjacent cargo should expect continued rate premiums relative to other corridors, even as the pace of increase moderates. Given that fuel price volatility tied to the Iran conflict remains an open variable, locking in longer-term contract rates now, rather than betting on further spot market softening, may reduce exposure to another sudden capacity shock.
FAQ
Why are air cargo rates falling even though they’re still higher than last year?
Rates are unwinding gradually from a premium built up after Middle East conflict-related disruption removed roughly 12% of global air cargo capacity in late February, but airlines have strong incentive to defend elevated pricing, so the decline is happening in small increments rather than a sharp correction.
Which air cargo routes are seeing the steepest rate declines?
The Asia-to-Europe corridor is weakest, with China-to-Western Europe rates down 22% to about $4.15 per kilogram, a decline that coincides with the EU’s removal of its duty-free threshold for low-value e-commerce imports.
What’s driving continued strength on Transpacific air cargo lanes?
Demand for AI-related goods, particularly semiconductors and computing hardware moving from Northeast and Southeast Asia to North America, has kept spot rates on that corridor about 33% above late-February levels, even as the pace of growth has slowed from June’s peak.
Sources
- Supply Chain Dive, “Muted air cargo peak season activity signals weaker H2” — https://www.supplychaindive.com/news/muted-air-cargo-peak-season-activity-signals-weaker-h2/827634/
- Xeneta, “Little appetite for peak season charters signals a weaker air cargo market over rest of 2026” — https://www.xeneta.com/news/little-appetite-for-peak-season-charters-signals-a-weaker-air-cargo-market-over-rest-of-2026
- Air Cargo Week, “Little appetite for peak season charters” — https://aircargoweek.com/little-appetite-for-peak-season-charters/
- STAT Times, “Xeneta sees softer H2 for air cargo” — https://www.stattimes.com/air-cargo/xeneta-sees-softer-h2-for-air-cargo-1360188
- Air Cargo News, “Xeneta: rates to climb by up to 15% in 2026 as Middle East conflict weighs in” — https://www.aircargonews.net/data/2026/07/xeneta-rates-to-climb-by-up-to-15-in-2026-as-middle-east-conflict-weighs-in/