
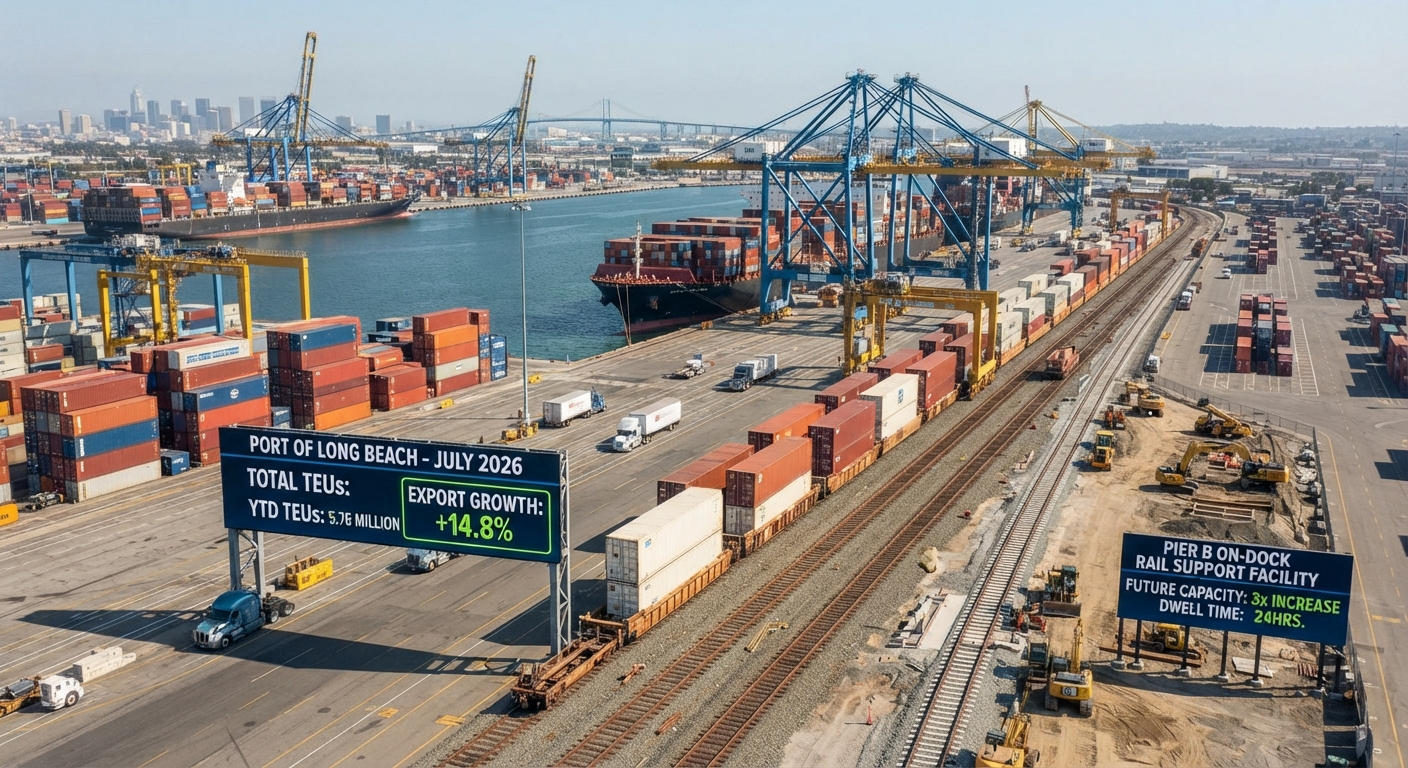

Long Beach moved 928,508 TEUs in July as exports jumped nearly 15% — here’s what’s driving the surge and what comes next for the port.
The Port of Long Beach handled 928,508 TEUs in July, its second-busiest July on record and fourth-highest monthly volume overall, even as total volume dipped 1.7% year-over-year — with export growth driving the strength behind an otherwise flat headline number.
The Numbers Behind the Surge
Imports were essentially flat, slipping just 0.1% to 467,461 TEUs, while exports jumped 14.8% to 104,843 TEUs. Empty container movements fell 7.4% to 356,205 TEUs — often read as a signal of future import strength. Through the first seven months of 2026, Long Beach has handled 5.76 million TEUs, up 1.2% versus the same period in 2025. Carriers report an unusually early peak season that began at the end of Q2, meaning July’s strength may pull volume forward rather than signal a stronger back half.
Infrastructure Investment Behind the Numbers
Long Beach is pursuing a 2050 vision targeting a doubling of annual container volume to 20 million TEUs, backed by $3.3 billion in planned capital investment over the next decade. The port approved new clean-air strategies including $40 million in joint funding with the Port of Los Angeles for a regional zero-emissions truck-charging network, and is developing the Pier B On-Dock Rail Support Facility — designed to triple on-dock rail capacity and cut rail dwell times from four days to just 24 hours.
What This Means for Procurement Teams
An early peak season means back-half volumes may soften. With carriers reporting cargo arriving ahead of the traditional schedule, shippers relying on Long Beach for Q4 delivery windows should confirm current booking assumptions rather than assuming typical seasonal patterns will hold.
Export capacity is genuinely improving, not just import capacity. The 14.8% export jump is a meaningful signal for US exporters using Long Beach as an outbound gateway — worth reassessing routing decisions if export capacity or cost had previously been a constraint.
Rail dwell time improvements are coming, but not yet. The Pier B facility’s promised drop from four-day to 24-hour rail dwell times is still under development — procurement teams shouldn’t build current planning around that improvement until it’s operational.
What This Means for Food & Beverage Supply Chains
Long Beach and its adjacent Port of LA handle a meaningful share of US refrigerated and perishable trade, so this data carries real relevance beyond general cargo shippers.
The export growth is worth watching closely for F&B exporters. A 14.8% jump in outbound volume is a broadly positive signal for US food and beverage exporters routing product through Long Beach — including meat, dairy, produce, and wine shippers who rely on West Coast gateways for Asia-Pacific and other export markets. Worth confirming with your freight forwarder whether this reflects genuinely improving vessel space and pricing for reefer/perishable exports specifically, since general container trends don’t always track one-to-one with refrigerated capacity.
An early peak season affects perishable timing differently than dry cargo. For F&B importers and exporters working with time- and temperature-sensitive product, the early peak season carriers are reporting matters more than it does for durable goods — a pulled-forward peak can mean earlier booking deadlines and tighter reefer plug availability than in a typical year. Confirm current vessel schedules directly rather than assuming historical seasonal booking windows still apply.
Rail dwell time improvements will matter significantly for perishables once live. The promised drop from four-day to 24-hour on-dock rail dwell at the Pier B facility would be a meaningful development for any F&B shipper moving refrigerated cargo inland by rail — faster dwell times directly reduce spoilage risk and cold-chain cost. Since this remains under development, don’t build current cold-chain planning around it yet, but it’s worth tracking as a genuine future improvement for temperature-sensitive supply chains specifically.
FAQ
How busy was the Port of Long Beach in July 2026?
Long Beach handled 928,508 TEUs, its second-busiest July on record and the fourth-highest monthly volume in the port’s history, despite a 1.7% year-over-year decline overall.
Why did exports grow while imports stayed flat?
The report doesn’t specify a single driver, but the 14.8% export increase significantly outpaced the roughly flat import volume, suggesting strengthening demand for US-origin goods moving through the port specifically.
What is the Pier B On-Dock Rail Support Facility?
It’s a Long Beach infrastructure project designed to triple the port’s on-dock rail capacity and reduce rail dwell times from four days to 24 hours, though it remains under development.
Sources
- Port Technology International, Port of Long Beach Posts Second-Busiest July
- WorldCargo News, July Surge for Long Beach
- FBJNA, Port of Long Beach Sees Second-Busiest July