
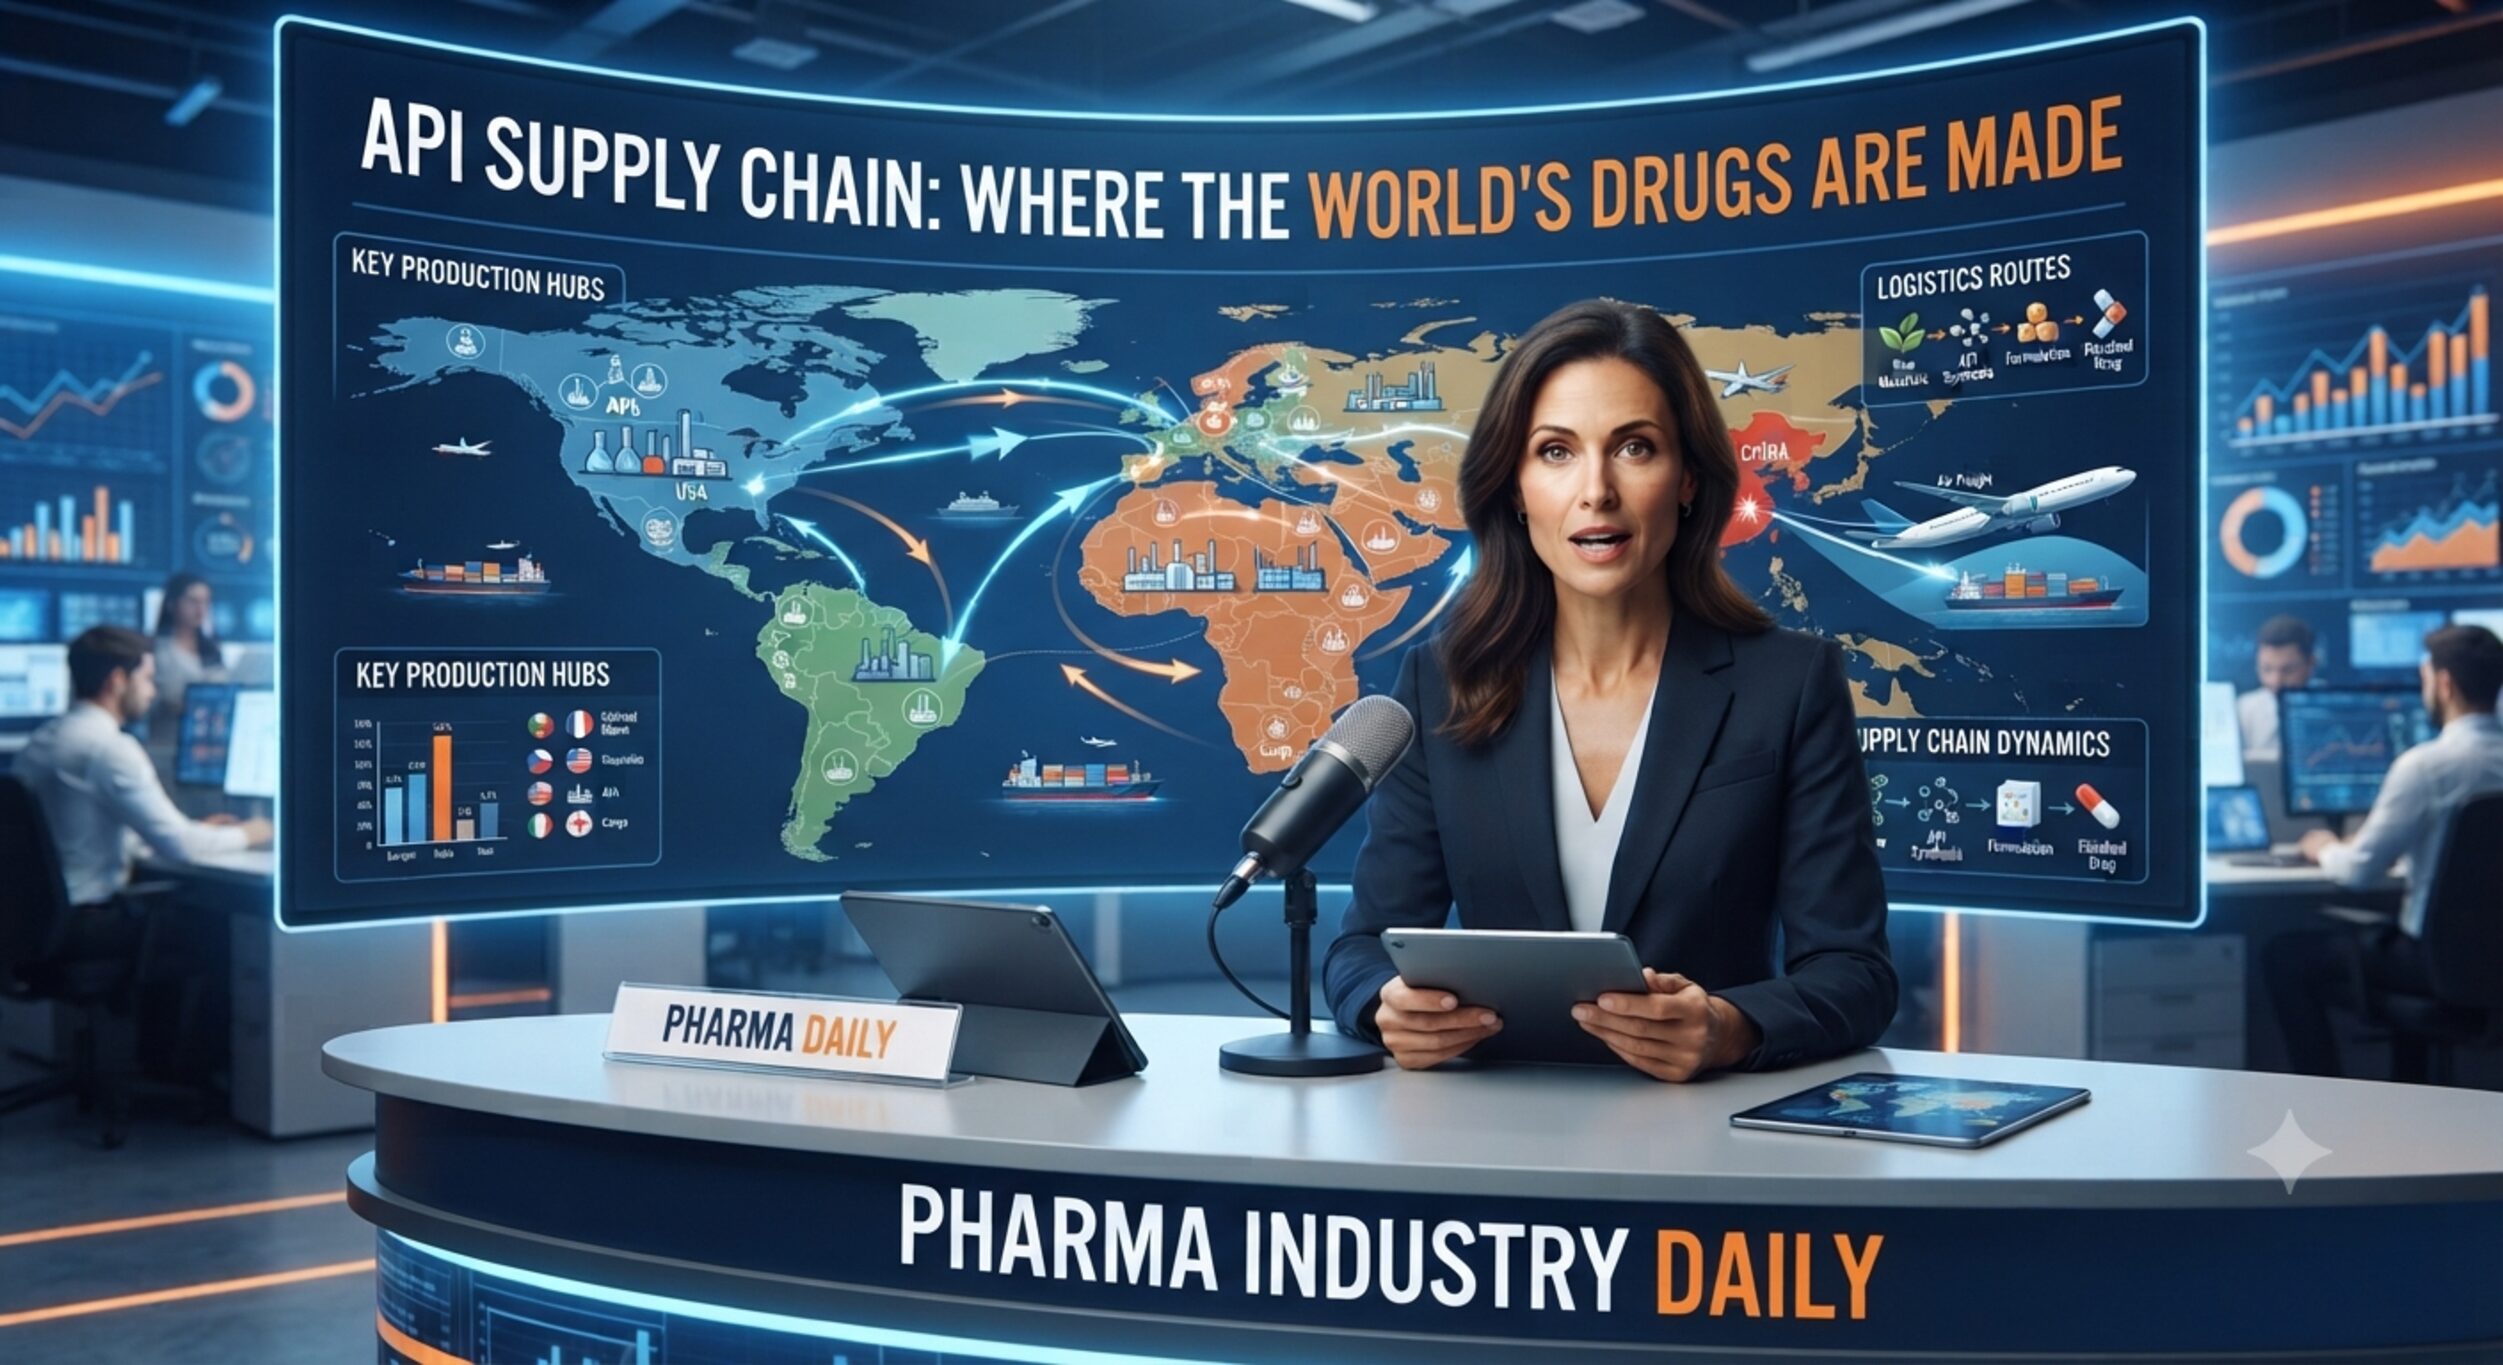
Inside the global API supply chain: where drug ingredients are made, why China and India dominate, and what concentration risk means for buyers.
Every medicine on every pharmacy shelf begins as a chemical compound made in a factory, and most of those factories are in two countries. The active pharmaceutical ingredient — the API — is the molecule that does the therapeutic work. Everything else in a tablet is filler, binder, coating and colour. Yet the API is the part of the pharmaceutical value chain that Western buyers understand least well, and it is the part where a single plant closure can empty hospital shelves eleven thousand kilometres away.
This report maps that supply chain: its size, its geography, the layer beneath the layer that almost nobody prices, and what the current wave of industrial policy is likely to do to landed cost over the next five years.
Table of Contents
What an API actually is, and why the distinction matters
An API is the biologically active component of a finished drug. A 500mg paracetamol tablet contains 500mg of paracetamol API plus excipients that hold it together and control how it dissolves. APIs are made either by chemical synthesis — the majority of the market — or by fermentation and biological processes, which covers most antibiotics and all biologics.
Three terms matter for anyone buying or reporting on this chain:
- KSM (key starting material) — the upstream chemical feedstock from which an API is synthesised
- Intermediate — a partially processed compound between KSM and finished API
- API — the finished active ingredient, ready for formulation into a dosage form
The reason this hierarchy matters commercially is that supply security at the API level is meaningless if the KSM behind it comes from a single source. This is the most common analytical error in pharmaceutical supply chain reporting, and the one that makes headline reshoring numbers misleading.
The market: large, growing, and difficult to size precisely
Estimates of the global API market cluster between roughly USD 235 billion and USD 287 billion for 2026, depending on whether the analyst counts captive production — APIs a company makes for its own finished products — alongside merchant sales to third parties. Grand View Research puts 2026 at about USD 287 billion; Fortune Business Insights at roughly USD 261 billion; The Business Research Company at about USD 261 billion. Compound growth forecasts run between 5.5% and 7% through the early 2030s.
Treat any single figure with caution. The spread reflects genuine methodological disagreement rather than sloppy research, and buyers should be wary of business cases built on a market-sizing number quoted without its definition.
Two structural splits are more useful than the headline number. Synthetic APIs account for roughly 60-71% of the market depending on the source, with fermentation and biological routes making up the balance. And captive manufacturing represents around half of output, meaning the merchant market that a procurement team can actually buy from is considerably smaller than the total.
Where APIs are actually made
Facility counts and production volumes tell two very different stories, and conflating them is how most commentary on this topic goes wrong.
By facility count, the picture looks balanced. The United States accounts for roughly 22% of FDA-registered API manufacturing sites, India 21%, China 20% and the European Union 19%. On that basis, no single geography dominates.
By volume, it is not balanced at all. Roughly 80% of the APIs used in US-marketed medicines originate from facilities in China and India. Around 78% of FDA-registered API sites sit outside the United States. The gap between the two measures reflects scale: Asian facilities are typically far larger and more specialised than their Western equivalents.
Drug Master File data sharpens the trend. India holds roughly 48% of all active API DMFs filed with the FDA, against about 8% for the United States — down from 10% in 2021. But China has been climbing fast: its annual API DMF filings rose from 134 in 2021 to 392 in 2024, and in that year China overtook India in new filings for the first time in more than two decades, taking around 45% of them.
The essentiality split is where the risk concentrates. Analysis from the US Pharmacopeia found India manufacturing about 29% of essential APIs and 38% of non-essential ones, with the United States producing around 18% of essential APIs despite holding only about 9% of non-essential output. China’s share of essential API manufacturing has moved into double digits from 8% the previous year. Critically, roughly 92% of essential APIs go into generic medicines — the lowest-margin, most price-eroded segment of the industry.
For individual molecules the concentration is starker still. China supplies an estimated 95% of US ibuprofen imports, 91% of hydrocortisone and 70% of acetaminophen.
The KSM problem: the layer nobody prices
India is routinely described as the pharmacy of the world, and by finished-dose volume it is. But India’s API industry runs on Chinese inputs.
Estimates of India’s dependence on China for KSMs, intermediates and solvents range from 60% to 80% depending on the basket measured and the year. Bulk drug imports from China rose from around 62% of India’s total by volume in FY14 to about 75% by FY23. For several fermentation-based antibiotics — penicillin G, streptomycin, amoxicillin — the dependence has at times approached 100%. India was until recently entirely import-dependent for clavulanic acid, with roughly 85% of its FY24 imports of that molecule coming from China.
China’s control of the KSM and intermediate layer is estimated at above 80%. This is the number that matters, because it means a Western buyer who switches from a Chinese API supplier to an Indian one may have changed the invoice without changing the underlying exposure. Reshoring the final synthesis step alone does not reduce the risk.
India’s policy response has been the Production Linked Incentive scheme for bulk drugs, launched in 2020 with an outlay of ₹6,940 crore (roughly USD 940 million) targeting 41 critical APIs, KSMs and drug intermediates. Forty-eight projects covering 33 drugs have been approved, attracting around ₹4,814 crore in investment against an initial commitment of ₹4,322 crore. The scheme runs to 2028-29.
The results so far are real but modest against the trend. Domestic penicillin G and clavulanic acid production has restarted after a two-decade gap. Yet India’s total imports of APIs, KSMs and intermediates still rose from about ₹27,361 crore in 2020-21 to ₹36,124 crore in 2024-25 — a 32% increase, driven by underlying demand growth outpacing import substitution. Industry figures have also reported Chinese producers cutting prices by 30-33% on PLI-targeted molecules, a straightforward tactic to suppress the return on Indian capacity investment.
Why the concentration happened, and why it is expensive to reverse
The United States, Europe and Japan produced around 90% of the world’s APIs until the mid-1990s. The migration east was not an accident of policy but the rational output of a procurement model that rewarded lowest unit cost in a market where generic drugs fill roughly 90% of US prescriptions while accounting for a small fraction of drug spend.
The cost gap is structural. US API manufacturing labour runs at roughly USD 35-55 per hour against USD 5-15 in Asian markets, before accounting for the environmental compliance costs that Western producers carry and many Asian producers historically did not.
This is why reshoring transfers cost rather than eliminating it. Analysis suggests a 25% tariff on Chinese pharmaceutical inputs would raise consumer-level drug prices by an estimated 10-14%, with generic manufacturers absorbing meaningful gross margin compression before contracts reprice. Major pharmaceutical companies have committed close to USD 150 billion in US manufacturing investment over the coming decade — Eli Lilly alone has announced around USD 27 billion for domestic API and sterile injectable expansion — but capacity takes years to build, and the political willingness to pay a resilience premium tends to fade once the shortage that prompted it recedes from memory.
Where the chain breaks: shortages and single points of failure
US active drug shortages reached 223 in the first quarter of 2026, a second consecutive quarterly increase, with roughly 77% of active shortages having begun in 2022 or later.
Shortages are not evenly distributed. They concentrate overwhelmingly in older, off-patent sterile injectables: chemotherapy agents, anaesthetics and electrolytes. The reason is economic rather than technical. Sterile injectable production requires aseptic manufacturing, dedicated cleanroom infrastructure and sterility testing, pushing per-unit costs to somewhere between five and twenty times those of oral solids at equivalent volumes — while market prices have compressed toward levels that cannot sustain the required quality infrastructure.
The result is a small number of qualified facilities running on thin margins with little redundancy. US emergency preparedness authorities have estimated that 90-95% of generic sterile injectables used in American critical care originate from materials sourced in China and India. An FDA import alert on a single Indian API facility, or a data integrity finding at a Chinese one, can interrupt supply for every finished-dose manufacturer dependent on that site.
The policy response is now real, and it changes landed cost
Three interventions are reshaping this market simultaneously.
United States. A Section 232 proclamation issued on 2 April 2026 imposes 100% tariffs on patented pharmaceuticals, biologics and associated ingredients — including APIs and key starting materials — imported into the US, effective 31 July 2026, with a later deadline for smaller companies. Exemptions run through domestic manufacturing commitments or Most Favored Nation pricing agreements with the administration. Generics have carried carve-outs in earlier iterations of the policy, but the structure has shifted repeatedly and buyers should verify current scope rather than rely on any published summary.
European Union. The Critical Medicines Act reached provisional agreement between the Council and Parliament on 12 May 2026, following a Parliament vote of 503 in favour to 57 against. It embeds resilience criteria that take precedence over price in public procurement for critical medicines, lowers the threshold for member states to request joint Commission-led procurement, and creates funding and permitting advantages for strategic manufacturing projects in the EU. Medicines for Europe has called for a €4 billion competitiveness fund to support generic and API production across more than 150 European sites.
India. The PLI scheme continues to 2028-29, with import substitution progressing on specific fermentation-based molecules while aggregate import dependence persists.
The common thread is that procurement criteria are being rewritten. For decades, pharmaceutical tendering optimised almost purely for price. Resilience, country of origin and supply security are now becoming scored criteria in their own right — and that is a structural change in how these products will be bought.
The import-dependent markets: Africa and the Global South
Africa accounts for roughly 3% of global pharmaceutical manufacturing while importing more than 80% of the pharmaceutical products it consumes. The continent had around 375 manufacturers as of 2019, against roughly 5,000 in China and 10,500 in India. North Africa hosts the largest concentration, with about 270 firms in 2024, most of them in Egypt.
Local capacity, where it exists, is concentrated in formulation and finishing rather than API synthesis. South Africa, Egypt, Kenya, Nigeria and Morocco hold most of it. Surveys of West African manufacturers have found effectively total API import dependence, extending to common excipients such as corn starch, magnesium stearate and cellulose derivatives. The African specialty API market is estimated at USD 2.8-3.5 billion for 2026, with anti-infectives — antibiotics and antiretrovirals — representing an estimated 35-40% of demand by volume.
Africa’s import mix is distinctive: the European Union supplies roughly 51.5%, India 19.3%, Switzerland 7.7%, China 5.2%, the United States 4.3% and the United Kingdom 3.3%. That EU weighting is why European reshoring policy carries a second-order risk for African supply. Critics of the Critical Medicines Act have warned that prioritising European production and embedding supply-to-Europe obligations in EU-funded projects could tighten global availability and raise prices for import-dependent markets.
The African Union’s Pharmaceutical Manufacturing Plan for Africa and national industrial policies in South Africa, Egypt and Kenya are pushing localisation, and UNIDO has been promoting lean local API manufacturing approaches. But API synthesis demands capital intensity, technical depth and regulatory infrastructure that take a decade to build, not a budget cycle.
What this means for buyers
Audit to the KSM, not the API. A supplier questionnaire that stops at API country of origin gives false comfort. Ask where the key starting material and the intermediates come from. If your Indian supplier’s KSM is Chinese, your China exposure is unchanged.
Assume country of manufacture is not visible in your purchasing data. For most buyers it is not captured in standard ERP or wholesaler feeds. If tariff exposure or origin risk now matters to your business, that data has to be collected deliberately.
Price the qualification cost before you dual-source. Changing API source is not a procurement decision alone. Different synthesis routes produce different polymorphs, particle size distributions and impurity profiles, with formulation and regulatory consequences. Qualification timelines run to years for regulated markets.
Watch fermentation-based molecules most closely. Antibiotics, and penicillin derivatives in particular, carry the highest concentration risk and the longest capacity rebuild timelines.
Expect resilience to become a scored criterion. If you sell into European public tenders, the Critical Medicines Act changes your evaluation. If you buy, expect the supplier base to reprice around it.
Build tariff pass-through language into contracts now. The US Section 232 framework has changed scope and timing several times. Contracts with no mechanism for allocating tariff cost between buyer and supplier will be renegotiated under pressure rather than by design.
Frequently asked questions
What is the difference between an API and a KSM?
An API is the finished active ingredient that produces a drug’s therapeutic effect. A KSM, or key starting material, is the upstream chemical feedstock from which that API is synthesised. Supply risk assessments that stop at API origin miss the KSM layer, where geographic concentration is typically higher.
Which country makes the most APIs?
It depends on the measure. India holds the largest share of active FDA Drug Master Files at roughly 48% and manufactures the largest share of both essential and non-essential APIs by volume. China leads new DMF filings and controls an estimated 80% or more of the KSM and intermediate layer that Indian production depends on.
Why do drug shortages keep happening if global capacity is adequate?
Shortages concentrate in off-patent sterile injectables, where per-unit manufacturing costs run five to twenty times those of oral solids while market prices have eroded below the level that sustains quality infrastructure. The result is few qualified facilities, thin margins and no redundancy — so a single inspection finding or plant outage propagates through the whole market.
Will tariffs bring API manufacturing back to the US and Europe?
Partially and slowly. Roughly USD 150 billion in US manufacturing commitments has been announced, but the labour cost gap is threefold to tenfold, capacity takes years to build, and reshoring final API synthesis without addressing KSM supply leaves the underlying dependence intact. Analysts generally expect targeted reshoring of critical molecules rather than wholesale reversal.
How exposed are import-dependent markets like Africa?
Highly. Africa imports more than 80% of the pharmaceutical products it consumes and accounts for around 3% of global manufacturing, with API synthesis capacity close to negligible. Because roughly half its pharmaceutical imports come from the EU, European reshoring policy is a material second-order risk to African supply and pricing.
Sources
- US Pharmacopeia, Quality Matters — Global manufacturing capacity for active pharmaceutical ingredients remains concentrated: https://qualitymatters.usp.org/global-manufacturing-capacity-active-pharmaceutical-ingredients-remains-concentrated
- US Pharmacopeia, Quality Matters — India leads essential API manufacturing, while China gains ground: https://qualitymatters.usp.org/india-leads-essential-api-manufacturing-while-china-gains-ground
- Council on Foreign Relations — The Pharma Choke Point: https://www.cfr.org/reports/the-pharma-choke-point
- Grand View Research — Active Pharmaceutical Ingredients Market Size Report: https://www.grandviewresearch.com/industry-analysis/active-pharmaceutical-ingredients-market
- Fortune Business Insights — Active Pharmaceutical Ingredient Market Size, Share: https://www.fortunebusinessinsights.com/active-pharmaceutical-ingredient-api-market-102656
- The Business Research Company — Active Pharmaceutical Ingredients Global Market Report 2026: https://www.thebusinessresearchcompany.com/report/active-pharmaceutical-ingredients-global-market-report
- LGM Pharma — Tariffs and Geopolitics: API Supply Chain Resilience: https://lgmpharma.com/blog/tariffs-api-supply-chain-resilience-in-2025/
- BioSpectrum India — India Inching Towards API Self-Reliance: https://www.biospectrumindia.com/features/73/27722/india-inching-towards-api-self-reliance-.html
- IJPS Journal — Bulk Drug Production in India: Evolution, Challenges, and Future Prospects: https://www.ijpsjournal.com/article/bulk-drug-production-in-india-evolution-challenges-and-future-prospects
- Business Standard — India’s import dependence on key pharma ingredients may reduce by half: https://www.business-standard.com/industry/news/india-s-import-dependence-on-key-pharma-ingredients-may-reduce-by-half-124111000342_1.html
- Council of the European Union — Critical Medicines Act: https://www.consilium.europa.eu/en/policies/critical-medicines-act/
- Pharmaceutical Technology — The Critical Medicines Act’s Impact on Pharmaceutical Manufacturing and Supply Resilience in Europe: https://www.pharmtech.com/view/the-critical-medicines-act-s-impact-on-pharmaceutical-manufacturing-and-supply-resilience-in-europe
- DCAT Value Chain Insights — Shoring up API Manufacturing and Supply in Europe: https://www.dcatvci.org/features/shoring-up-api-supply-in-europe/
- Health Policy Watch — EU Parliament Backs Critical Medicines Act, Sparking Supply Concerns In Africa: https://healthpolicy-watch.news/eu-parliament-backs-critical-medicines-act/
- Pharmaceutical Commerce — How New Trade Policies Are Shifting Pharma Supply Chain Strategy: https://www.pharmaceuticalcommerce.com/view/how-new-trade-policies-are-shifting-pharma-supply-chain-strategy
- Becker’s Hospital Review — US drug shortages trending upward in 2026: https://www.beckershospitalreview.com/pharmacy/us-drug-shortages-trending-upward-in-2026/
- African Business — Momentum builds for local drug production: https://african.business/2026/04/trade-investment/momentum-builds-for-local-drug-production
- IndexBox — Specialty Active Pharmaceutical Ingredients Market in Africa: https://www.indexbox.io/store/africa-specialty-active-pharmaceutical-ingredients-market-analysis-forecast-size-trends-and-insights/
- University of Cape Town — African Pharmaceutical Sector Landscape Analysis: https://commerce.uct.ac.za/media/672437
- Nature, Communications Medicine — Agile local manufacturing of active pharmaceutical ingredients in Africa: https://www.nature.com/articles/s43856-025-01080-6

