
Container Shipping, Energy Shocks, and Agricultural Pricing: The 2026 Supply Chain Reckoning
Container shipping enters 2026 as structural overcapacity collides with Red Sea uncertainty, energy volatility, and agricultural export margins—reshaping trade costs across all routes. Here’s what supply chain leaders need to know.
Table of Contents
The Container Market: From Crisis to Correction
The global container shipping industry has shifted dramatically since the pandemic-era chaos of 2021–2023. The market is no longer in crisis mode; instead, it’s entering a complex normalization phase where rates have stabilized but underlying dynamics remain deeply unsettled.
Between 2020 and 2023, major shipping carriers capitalized on record-breaking freight rates by placing enormous orders for new vessels. This resulted in over 800 new container ships—representing more than 7 million additional TEUs of capacity—being delivered between 2024 and 2026. The container shipping order book-to-fleet ratio now stands at an unprecedented 31.6%, creating structural overcapacity not witnessed since the 2016 downcycle.
The consequence is paradoxical. Base rates on stable routes have normalized downward toward pre-disruption levels. Yet volatility persists across certain corridors, driven by geopolitical risk, fuel cost shocks, and route diversions that keep segments of the market tight.
Freight Rate Reality: Bifurcated Pricing
Transpacific and US domestic routes have largely stabilized. Annual contracts negotiated in late 2025 ranged from $1,800–$2,400 per FEU (40-foot equivalent unit) on the US West Coast and $2,800–$3,600 on the US East Coast, with minimum quantity commitments loosening to 60–70% for competitive shippers. Carriers’ breakeven threshold on transpacific is estimated at $1,200–$1,600/FEU, leaving limited room for further downside without operational stress.
Asia-Europe routes, however, tell a different story. Spot rates remain elevated at $3,500–$4,500/FEU (compared to pre-Red Sea disruption levels of $1,200–$1,500), with transit times extended 10–14 days due to Cape of Good Hope routing to avoid Houthi attacks in the Suez Canal. Industry consensus holds that diversions will likely continue through at least 2027, though carriers are periodically testing the route.
The risk premium attached to Suez uncertainty—war risk surcharges (WRS) and congestion premiums—historically ranges from $500–$1,500 per container. A full return to Suez routing would release massive capacity into an oversupplied market and push rates sharply lower. An escalation forcing renewed diversions, by contrast, could spike rates 20–30% within weeks on Asia-Europe lanes.
Energy Volatility and Bunker Fuel: The Hidden Cost Driver
Oil price shocks have a direct and immediate impact on container shipping costs through bunker fuel (marine diesel) pricing, which represents the single largest variable cost in ship operations.
In early 2026, oil prices rose sharply following geopolitical disruptions in the Middle East, with the Iran war leading to a blockade of maritime traffic through the Strait of Hormuz—one of the world’s most critical oil choke points, carrying approximately one-fifth of global oil supply. Bunker fuel prices spiked to $600–$650 per metric ton for Very Low Sulfur Fuel, driving dramatic increases in freight costs.
The per-container impact varies sharply by vessel age and size. On a China-to-US West Coast voyage, fuel costs per 20-foot container rose from $155 to $269 for the newest, most efficient ships—but from $360 to $626 for older vessels. This differential creates incentives for carriers to deploy modern tonnage on premium routes and retire or underutilize aging capacity.
Today, bunker adjustment factors (BAF) account for $400–$700 of every FEU quote, making fuel price tracking as critical as base rate negotiation for procurement teams. Over the past four months alone, transpacific container rates jumped from around $1,800 to nearly $4,200—with fuel costs being the dominant factor.
Agriculture Supply Chains: Logistics Margin Compression
For agricultural exporters and food industry procurement teams, the shipping-energy-agriculture nexus is where margin compression becomes most acute.
Commodity pricing is inherently tied to logistics costs through a mechanism called CIF (cost, insurance, freight) pricing. Most agricultural commodities are quoted as FOB (free on board) plus freight; any increase in transport costs directly affects the CIF price that importers ultimately pay and the export parity that determines whether domestic producers export or sell locally.
The pricing cascade works like this: trade surge → corridor congestion → freight rate increase → CIF adjustment → regional price divergence. When shipping corridors become congested—whether due to seasonal demand spikes (fertilizer pre-planting buying, citrus harvest export windows, or container repositioning cycles)—container capacity tightens, rates spike, and commodities become more expensive for importers while export parity pricing for producers may actually decline if they bear freight cost increases.
Soybean markets have been particularly volatile, with demand and pricing rippling through supply chains as exporters struggle to recover from pre-tariff and pre-slowdown levels. Fertilizer shipments, with their predictable seasonal rhythm ahead of planting, create demand spikes that stress shared logistics infrastructure (rail, trucking, terminals, warehouses), raising rates across containerized supply chains when those lanes overlap.
South Africa Agricultural Context: Port Bottlenecks and Export Margin Risk
South Africa’s agricultural sector is experiencing growth alongside rising logistics headwinds. Agricultural exports jumped 11% year-on-year in the first quarter of 2026, reaching $3.7 billion, with strong international demand for grapes, apples, pears, maize, wine, sugar, and avocados.
However, that growth masks underlying margin pressure. The agricultural business chamber’s data reveals that while export volumes are solid, the financial conditions of many growers have been negatively affected by difficulties at the Port of Cape Town. Citrus farmers and strawberry growers entering peak export season face three compounding cost pressures: domestic port efficiency challenges, elevated shipping costs, and reduced access to Middle East markets due to geopolitical tensions.
For a country whose grain market is valued at $9.2 billion and projected to grow at 5.34% CAGR through 2031—driven by corn self-sufficiency, regional demand, and rising feedstock for biofuels—logistics reliability and cost control are competitive necessities. Major export corridors from South African ports are now pricing in Middle East risk premiums and Red Sea diversions, making alternative routing and carrier diversification essential strategies for exporters.
Buyer and Procurement Implications
For food and beverage procurement teams:
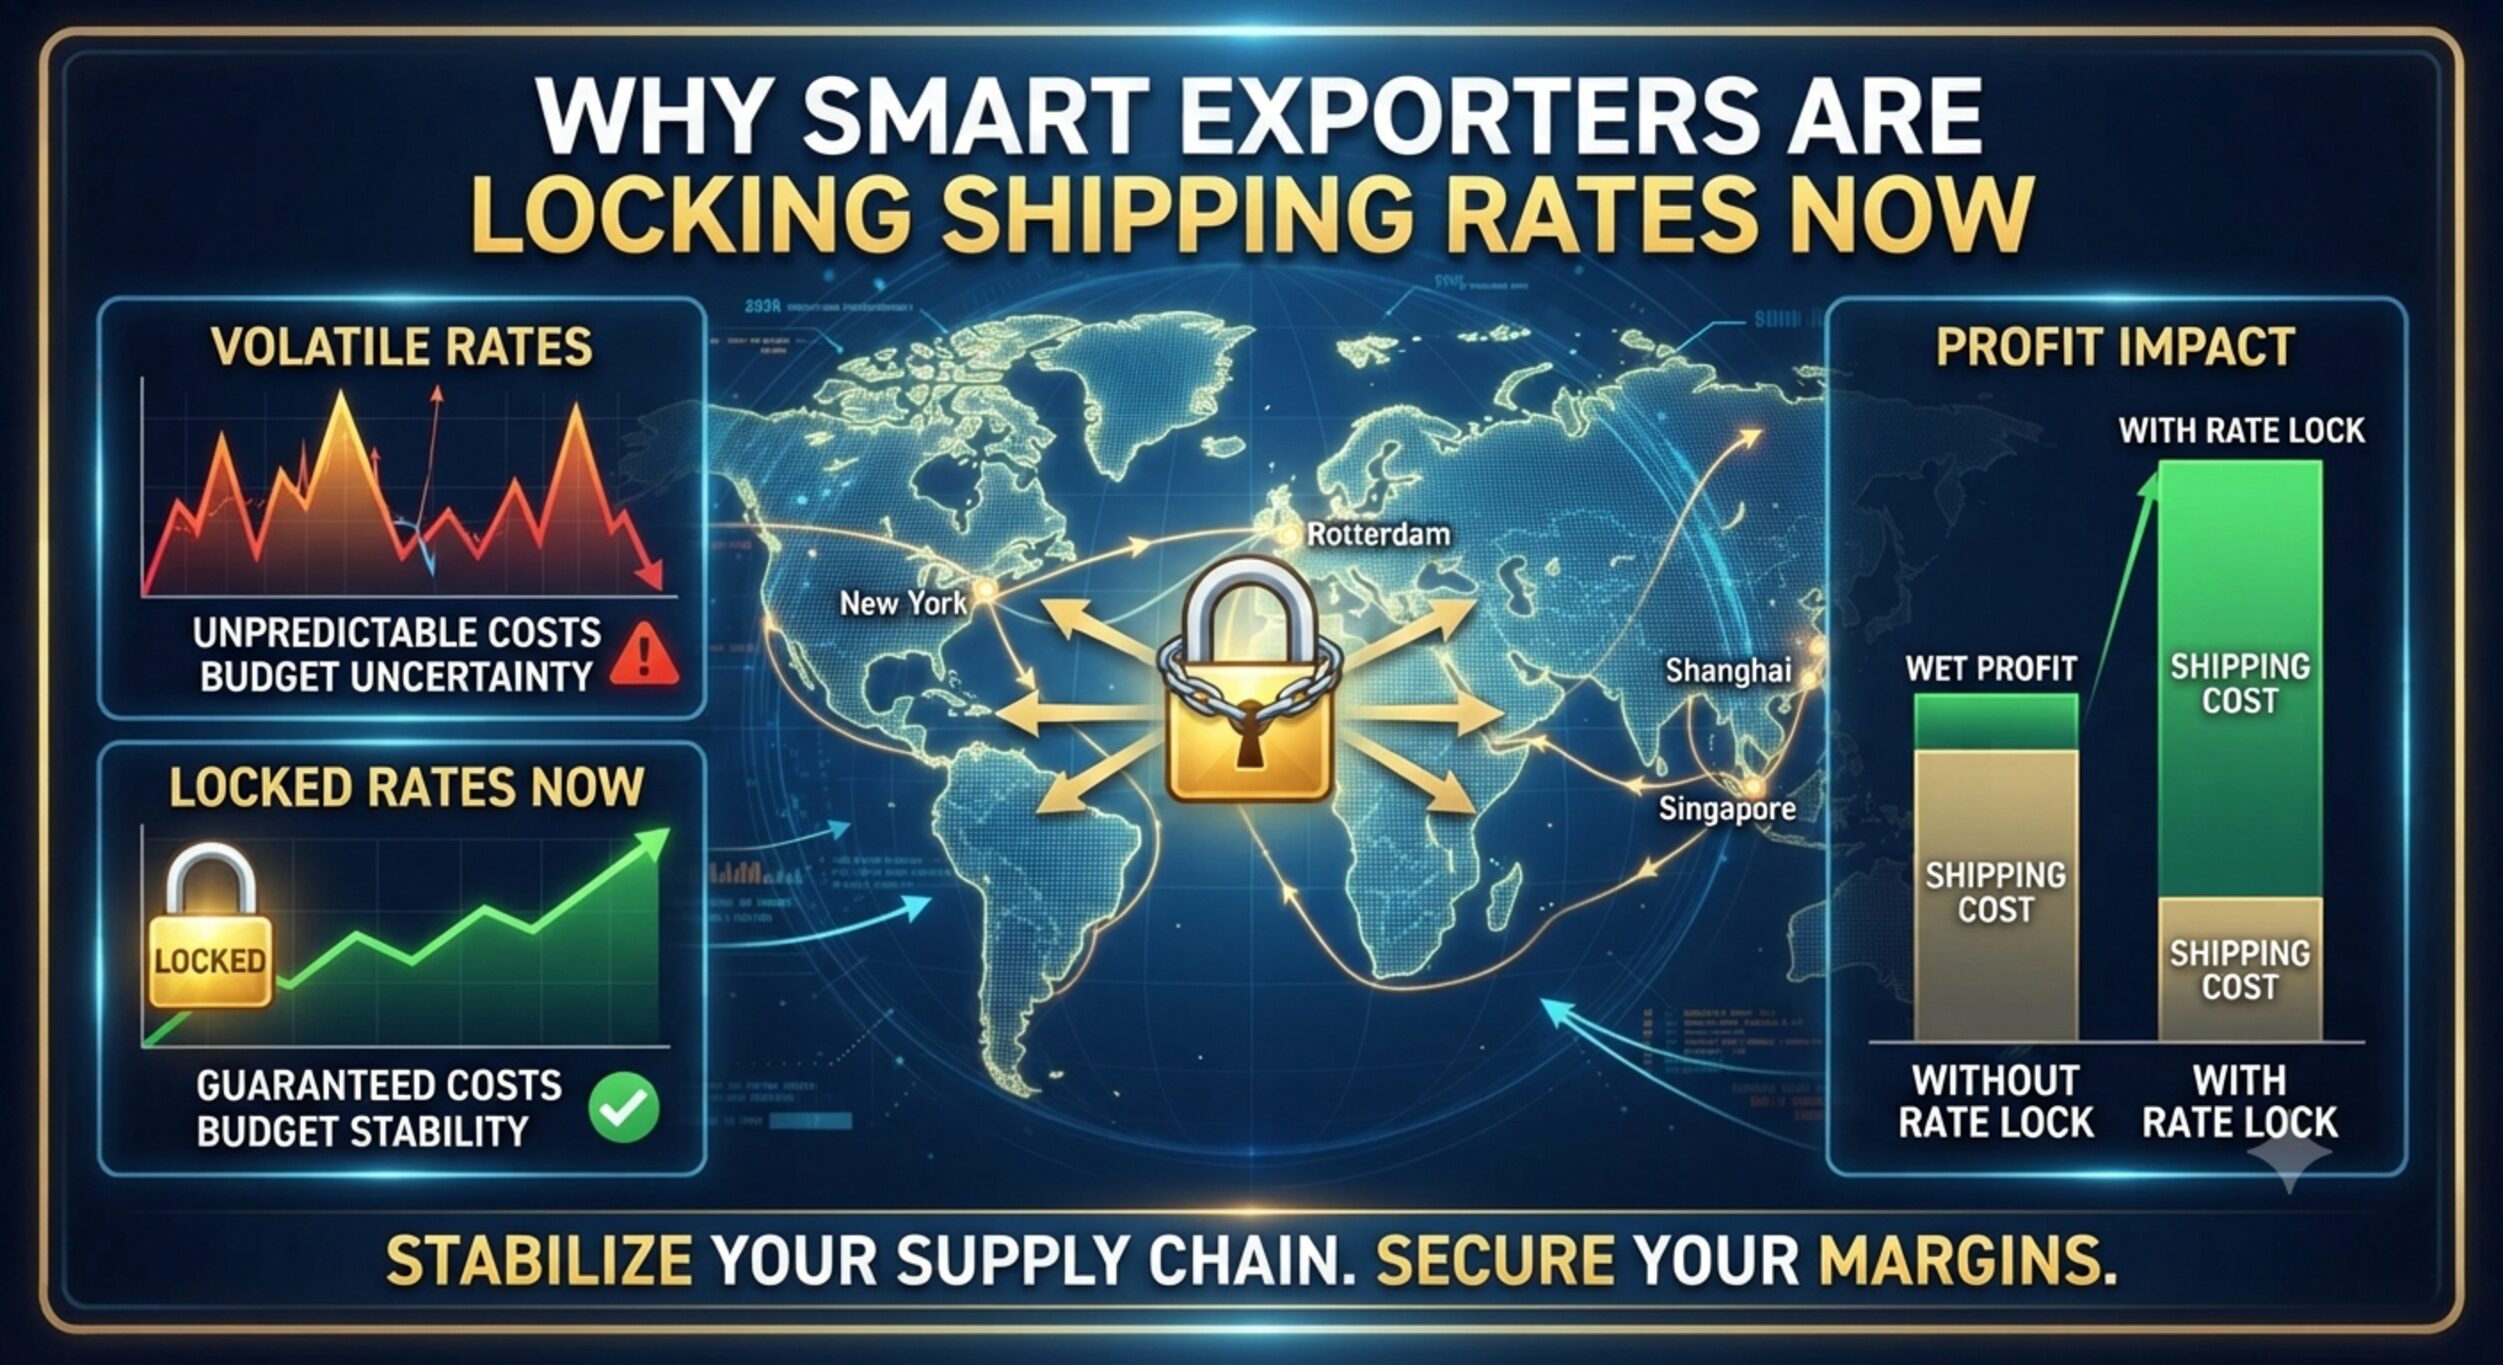
- Lock annual contract rates on transpacific routes now while oversupply persists; secure minimum quantity commitments at 60–70% to maintain flexibility.
- Separate fuel surcharges (BAF) as a line item in rate negotiations; establish fuel price triggers that automatically adjust rates if bunker prices exceed agreed thresholds.
- Monitor Red Sea route status weekly; diversify carriers to ensure access to multiple routing options if Suez closes or becomes cost-prohibitive.
For agricultural exporters and traders:
- Recognize that shipping cost increases directly erode export parity pricing. Factor seasonal logistics congestion into forward price calculations, particularly during fertilizer pre-season and citrus/fresh produce harvest windows.
- Evaluate port efficiency as a strategic competitive factor. Delays at Cape Town add demurrage, detention, and inventory carrying costs that compress margins on perishable goods.
- Plan for margin volatility: use shipping forward curves and fuel price hedging strategies if operating at scale; for smaller shippers, prioritize carrier and route diversification over aggressive rate negotiation.
For supply chain planners:
- Build 2–3 week buffer windows for port congestion in harvest and peak shipping seasons.
- Monitor commodity-specific freight rates (FAK surcharges for specialty goods can add $200–600/FEU) and adjust sourcing or pricing accordingly.
- Track local vs. national container pricing trends; tight regional demand for agricultural-use containers (storage, sorting, transport) can keep prices firm even as national ocean freight rates decline.
Related
FAQ: Container Shipping, Energy, and Agricultural Pricing
Why do fuel prices matter so much more now than before?
Fuel costs represent up to 40% of total carrier operating expenses and are now more volatile due to geopolitical tensions and energy transition-driven supply constraints. A $100/MT swing in bunker fuel translates to roughly $40–50 per container in additional cost—meaningful on routes where base rates have normalized to $1,200–$1,600/FEU. Energy shocks ripple immediately into freight surcharges because carriers pass through BAF adjustments within days or weeks of price moves.
If container capacity is oversupplied, why are Asia-Europe rates still so high?
Structural oversupply on main East-West routes masks severe localized tightness on routes disrupted by geopolitical risk. The Red Sea diversions absorb capacity that would otherwise flow to other corridors. When Houthi attacks persist, carriers reroute around Africa, adding 10–14 days to transit and consuming vessel days that would serve competing routes. Supply-demand imbalance is route-specific, not global.
How does a shipping rate increase actually reduce export parity for farmers?
Farmers exporting commodities receive FOB (free on board) prices set by global benchmarks minus freight and handling costs. When freight rates rise, the CIF (landed) price that importers pay rises, but FOB prices don’t necessarily follow. If importers demand lower CIF pricing to maintain margins, FOB prices are bid down, transferring the shipping cost increase entirely to exporters. This is especially acute for price-takers in competitive commodities like grains and soybeans.
What’s the breakeven freight rate for carriers, and why does it matter to shippers?
Estimated at $1,200–$1,600/FEU on transpacific routes, breakeven is the rate below which carriers cannot operate profitably. When spot rates fall below breakeven, carriers implement blank sailings (skip scheduled departures) and blank sailings reduce available capacity, often pushing rates back up. This creates a price floor for shippers—rates rarely fall below breakeven for extended periods.
When will the Red Sea situation resolve, and what would happen to shipping rates?
Industry consensus is that diversions will persist through at least 2027, but the timeline remains uncertain. A full return to Suez routing would release massive latent capacity and push Asia-Europe rates sharply lower (potentially $1,200–$1,500/FEU). An escalation forcing renewed diversions would spike rates 20–30% within weeks. The binary risk (resolution vs. escalation) makes hedging and carrier diversification essential.
How should South African agricultural exporters prepare for sustained high logistics costs?
Prioritize port diversification where feasible (alternate to Port of Durban if Cape Town congestion persists), lock in annual contracts for core export flows, and adopt forward-pricing models that treat fuel and route risk as separate cost variables. For perishables, invest in supply chain visibility to minimize dwell time and demurrage—these are controllable costs that often dwarf freight rate volatility.
Sources
| Source | Publication Date | Focus Area | Key Data Point |
|---|---|---|---|
| Container Shipping Forecast 2026: Rates, Routes and Risks | May 21, 2026 | Market normalization, Red Sea risk, order book dynamics | Order book-to-fleet 31.6%; Houthi attacks ongoing; $20–30% rate spike risk on diversion escalation |
| Container Shipping Procurement Outlook 2026 | April 16, 2026 | Capacity, demand, pricing cycles | Structural oversupply peaking 2027; scrapping momentum critical; Red Sea has absorbed excess capacity |
| 2026 Freight Rate Forecast: Why Shipping Prices Are Dropping | March 23, 2026 | Rate trends, EU ETS impact, route economics | Green surcharges $150–400/container; War Risk Surcharges $500–1,500 during disruption; Cape rerouting adds $1,000–$2,000/FEU |
| 2026 Freight Market Outlook: Container Rates, Capacity, and Strategy | January 3, 2026 | Contract rates, capacity dynamics, shipper leverage | US West $1,800–$2,400/FEU; US East $2,800–$3,600/FEU; Asia-Europe $3,500–$4,500/FEU (spot); BAF $400–$700 |
| Commodity Trade in 2026: How Logistics Bottlenecks Drive Price Volatility | February 25, 2026 | Agricultural pricing, FOB+freight mechanism | Trade surge → congestion → rate increase → CIF adjustment; major ag corridors see higher rate increases |
| Container Shipping Rates in 2026: Fertilizer Impact | January 30, 2026 | Seasonal logistics, commodity crowding | Fertilizer pre-season creates shared logistics stress; surcharges common when labor/equipment stretched |
| Oil Prices and Container Shipping Costs | July 2026 (5 days ago) | Fuel shock, vessel efficiency impact | $155→$269/TEU (new ships); $360→$626/TEU (old ships) on China-US West Coast; Drewry Index ~$1,930 Feb 2026 |
| Economic Factors Affecting Shipping Industry Costs in 2026 | March 25, 2026 | Fuel, crew costs, regulatory compliance | Bunker fuel $600–$650/MT; officer shortage 26,240; wage pressure 8–12% annually |
| Global Shipping Outlook 2026: Rates, Capacity, and China–U.S. Trade Trends | November 17, 2025 | Demand trends, soybean volatility, trade policy | Soybean demand/pricing volatility ripples through chains; exporters far from pre-tariff levels |
| South Africa Agricultural Exports Rise Despite Port Bottlenecks | May 31, 2026 | Regional agricultural growth, logistics constraints | Q1 2026: +11% YoY to $3.7B; Africa 44%, EU 26%, Asia/ME 14%, Americas 4% |
| SA’s Farm Exports Jump 11% Despite Port Bottlenecks | May 26, 2026 | Port efficiency, US tariff impact | Cape Town congestion eroding grower margins; US exports -33% (tariff front-loading factor) |
| South Africa Grain and Feed Annual | March 25, 2026 | Grain sector outlook, regional trade hub role | Sector stable/resilient; corn area steady; wheat stable; rice re-export hub leveraging logistics networks |
| South Africa’s Agriculture Enters a Critical Month | April 12, 2026 | Crop forecast, input costs, export logistics | Citrus exports +3–5%; Middle East access difficult; fuel prices, shipping costs, logistics challenges top-of-mind |
| South Africa Grain Market – Production & Analysis | January 16, 2026 | Market size, forecast, competitive positioning | Market: $9.2B (2025) → $9.69B (2026) → $12.57B (2031) at 5.34% CAGR |
| Rising Fuel Costs Complicate Trans-Pacific Shipping Contracts | April 15, 2026 | Bunker price impact, BAF negotiations | Iran war disruption; bunker prices doubled at major hubs; BAFs + emergency surcharges emerging |
| Shipping Costs Surge as Fuel Prices Hit Near-Record Highs | June 29, 2026 | Geopolitical energy disruption, carrier cost pass-through | Transpacific rates jumped $1,800→$4,200 in 4 months; fuel up to 40% of carrier operating expenses |

