
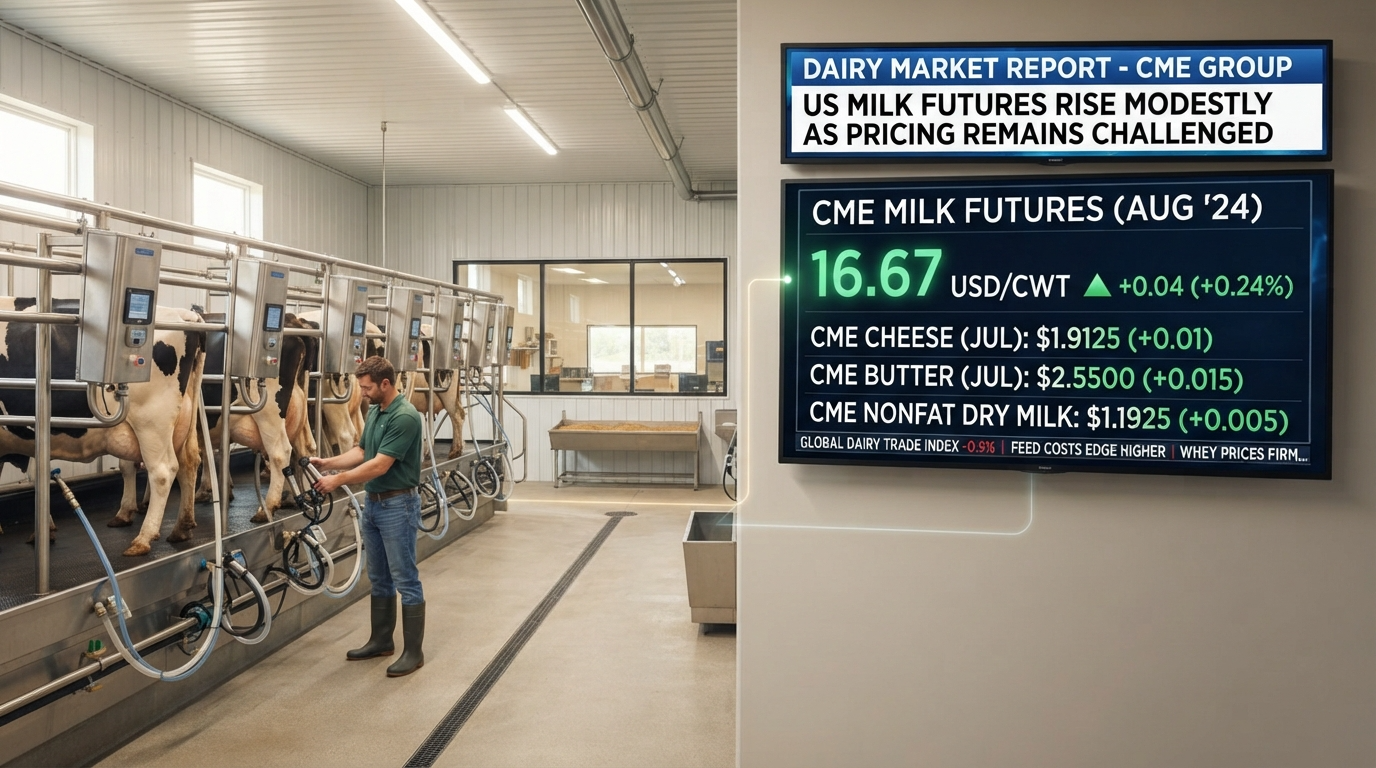

U.S. milk futures climbed to $16.67 per hundredweight on August 31, 2026, marking gains that obscure a deeper crisis: U.S. dairy production continues to outpace consumption, global competition is intensifying, and USDA emergency purchases are the only thing preventing a price collapse that would devastate farm profitability.
The Contradiction: Prices Up, but Fundamentals Down
The milk futures market on August 31 presented a paradox:
- Daily gain: +0.06% (essentially flat day-to-day trading)
- Monthly gain: +6.45% (genuine monthly strength)
- Year-over-year change: -3.36% (still below 2025 pricing)
- Price level: $16.67 per cwt (historically low for late summer)
This contradiction reveals the actual market state: short-term technical recovery masking long-term structural weakness.
To understand what this means, you need to know that:
- $16.67 per cwt is approximately $0.36 per gallon wholesale milk equivalent
- A typical Wisconsin dairy farm with 300 cows produces roughly 900,000 pounds of milk monthly
- At $16.67/cwt, that farm grosses approximately $150,000 per month, but nets roughly $45,000-60,000 after production costs
- Break-even for most dairy farms is $17.50-18.50/cwt in 2026
Translation: Milk prices are currently below sustainable levels for average dairy operations, despite the August gains.
Why August’s 6.45% Monthly Gain Masks August’s Fundamental Failure
The milk futures recovery in August requires context. Prices rose 6.45% during a month when dairy fundamentals actually deteriorated:
Production Continued Climbing
- U.S. milk production is tracking 2-3% higher than 2025 year-to-date
- Herd numbers remain elevated (9.47-9.50 million dairy cows as of August)
- Per-cow productivity continues rising (seasonal peak production)
- High-productivity genetics and improved feeding mean each cow is producing more milk despite challenging economics
Demand Remained Flat
- Domestic fluid milk consumption continues its decade-long decline (-1 to -2% annually)
- Cheese production (largest milk end-use) is flat to declining
- Butter and dairy ingredient exports face global competition
- No new demand drivers emerged in August
Global Oversupply Intensified
- European Union production remains robust despite their own oversupply concerns
- New Zealand dairy production peaked seasonally
- Global milk prices fell 3-5% in August
- Export competition reduced U.S. dairy product export opportunities
The math: Production up, demand flat, global prices down = the August price recovery was technical, not fundamental.
USDA Emergency Purchases: The Floor Under Milk Prices
The most important fact in the milk market story isn’t the price—it’s that USDA is actively purchasing milk and dairy products to manage oversupply.
Here’s how USDA’s Commodity Credit Corporation (CCC) emergency purchases work:
The Mechanism
USDA buys surplus milk/dairy products at set intervention prices:
- Butter/butterfat purchases support prices through the Commodity Supplemental Food Program (CSFP)
- Cheese purchases for food assistance programs
- Milk powder purchases for storage and later release
- Direct milk purchases during acute oversupply events (less common but used when markets break)
The Impact on Price
USDA’s purchasing creates a price floor below which buyers know USDA will absorb supply. This prevents panic selling and price collapse, but it also:
- Masks true oversupply severity (if USDA weren’t buying, prices would be significantly lower)
- Distorts market signals (production doesn’t naturally decline because the floor prevents pain)
- Creates fiscal pressure (USDA CCC funds are limited and can’t solve structural oversupply indefinitely)
Reality check: Without USDA emergency purchases, milk prices in August would likely have traded $15.50-16.00/cwt instead of $16.67, potentially triggering the 10-15% price decline that would force significant herd liquidation.
The Global Competitive Vise: EU and New Zealand Pressure
U.S. dairy producers don’t compete in isolation—they compete against:
European Union Dairy
- EU milk production: 160+ million tons annually, similar scale to U.S.
- EU export strategy: Aggressive commodity cheese, milk powder, and butter exports
- EU price: Currently trading 5-8% below U.S. equivalent, creating export headwinds
- EU subsidies: CAP (Common Agricultural Policy) provides support reducing need for high prices
- Result: EU dairy products undercut U.S. in global markets, reducing export demand for U.S. products
New Zealand Dairy
- NZ production: 20-22 million tons annually (smaller scale, but highly export-focused)
- NZ strategy: Grass-fed, low-cost commodity production
- NZ price competitiveness: 10-15% cheaper than U.S. equivalent on many products
- Export orientation: 95%+ of NZ dairy production is exported
- Result: NZ pressure is particularly acute in Asian markets and commodity dairy powder
Combined Global Impact
- U.S. exports declining: Butter, cheese, and milk powder exports down 8-15% year-over-year
- Domestic market pressure: Reduced export outlet forces more domestic supply to domestic markets
- Price pressure: Domestic cheese and fluid milk prices depressed by global competition
- Producer revenue: U.S. dairy farmers lose both on price and on volume
Production Outpacing Consumption: The Structural Problem
The core issue isn’t temporary—it’s structural. U.S. milk production growth is systematically outpacing consumption growth:
Production Side
- Herd size: Stable to growing (9.47-9.50 million cows)
- Productivity per cow: Growing 1-1.5% annually through genetics and management
- Net result: Overall production growing 1.5-2.5% annually
Consumption Side
- Fluid milk demand: Declining 1-2% annually (demographic and lifestyle shift)
- Cheese demand: Flat to slightly declining (market saturation)
- Butter demand: Growing but from a small base (not enough to offset fluid decline)
- Milk powder demand: Dependent on export markets (which are facing competition)
- Net result: Overall consumption flat to slightly declining
The Gap
When production grows 1.5-2.5% and consumption grows 0%, you have a growing surplus that:
- Accumulates as inventory
- Pressures prices downward
- Forces USDA intervention to absorb excess
- Creates the structural oversupply that persists despite short-term price recovery
This gap won’t close without: (1) significant herd liquidation, (2) demand acceleration (unlikely), or (3) export market opening (trade-dependent, uncertain).
Dairy Farmer Profitability: The Real Story Behind the Price
The $16.67/cwt price tells a profitability story that’s deeply concerning:
Tier 1: Large Efficient Operations (500+ cows)
- Production cost: $15.50-16.00/cwt
- Current price: $16.67/cwt
- Gross margin: $0.67/cwt ($6 per 1000 lbs milk)
- Profitability status: Marginally profitable (50-100 bps profit margin)
- Sustainability: 6-12 months at current prices before capital erosion
Tier 2: Mid-Scale Operations (200-500 cows)
- Production cost: $17.00-17.50/cwt (higher cost structure)
- Current price: $16.67/cwt
- Gross margin: NEGATIVE (-$0.33 to -0.83/cwt)
- Profitability status: UNPROFITABLE at current prices
- Survival strategy: Drawing down equity, taking on debt, or exiting
Tier 3: Small and Marginal Operations (<200 cows)
- Production cost: $17.50-19.00/cwt (highest cost structure)
- Current price: $16.67/cwt
- Gross margin: NEGATIVE (-$0.83 to -2.33/cwt)
- Profitability status: SEVERELY UNPROFITABLE
- Outlook: Accelerated liquidation and farm exit
Aggregate Impact
Roughly 40-45% of U.S. dairy farms are currently unprofitable at $16.67/cwt milk prices. These farms are:
- Accumulating losses that must be recovered or written off
- Depleting equity/capital reserves to cover operating losses
- Delaying equipment replacement and herd genetics investment
- Facing pressure to liquidate or consolidate
The Technical Bounce: Why Did Prices Rise in August?
Understanding the August rally requires looking at what’s not structural:
Factor 1: Seasonal Production Shift Expectations
- Late summer typically sees a decline in milk production as heat stress reduces yields
- Market expected a 2-3% production decline in September-October
- Some price recovery priced in this seasonal shift
- Status: Typical seasonal pattern, not new fundamentals
Factor 2: Feed Cost Stabilization
- Corn and soybean meal prices stabilized in August after summer weakness
- Some producers might increase feed purchases if prices are deemed “cheap”
- Improved feed cost outlook raises perceived future profitability
- Status: Feed costs remain elevated vs. 2025, so this is small relief only
Factor 3: Futures Technical Trading
- Milk futures had declined from $17.00+ in July to $16.20+ in August
- Technical traders identified support levels and rebought
- Short positioning unwound, driving prices higher
- Status: Pure technical, no fundamental improvement
Factor 4: USDA Intervention Signals
- Reports of USDA dairy purchases supported sentiment
- Market interpreted CCC activity as USDA support floor
- Traders bought on the perception of government price floor
- Status: Real, but creates moral hazard (masks underlying oversupply)
Critical point: None of these factors solved the fundamental production-vs.-consumption mismatch or global competitive pressure. They’re all temporary relief, not structural solutions.
What Needs to Happen to Fix Dairy Fundamentals
Milk prices need to rise to $18.00-19.00/cwt to be sustainable for most farms. That would require one or more of:
Option 1: Significant Herd Liquidation
- 10-15% reduction in U.S. dairy herd (roughly 1.2-1.5 million cows)
- Would take 12-18 months to complete
- Would reduce annual production by 15-18 billion pounds
- Would eliminate current oversupply
- Probability: Low (would cause tremendous pain to producers, political pressure on regulators)
- Timeline: If it happens, expect 2-3 years to complete
Option 2: Demand Acceleration
- Fluid milk consumption reverses decade-long decline
- Cheese demand surges from 38 lbs/person to 42+ lbs/person
- International demand for dairy exports explodes
- Probability: Very low (demographic and lifestyle trends are opposite)
- Timeline: Unrealistic within planning horizon
Option 3: Export Market Opening
- Trade barriers fall and U.S. dairy access to China, Mexico, or other key markets improves
- U.S. dairy exports grow 20-30% annually
- Export markets absorb excess domestic production
- Probability: Trade-dependent, politically uncertain
- Timeline: If happens, probably 2027-2028 timeframe
Option 4: Global Price Recovery
- EU and NZ production constraints push global dairy prices up
- U.S. dairy becomes more competitive on global pricing
- Export demand recovers
- Probability: Depends on weather, global dairy policy changes
- Timeline: Unpredictable (could happen in months or years)
Timeline: How Long Can This Last?
The current situation (prices below sustainable levels, USDA emergency purchases) is not indefinitely sustainable:
Next 3 Months (Sept-Nov 2026)
- Seasonal production decline provides temporary support
- Prices may rise modestly to $16.80-17.20/cwt
- USDA continues emergency purchases
- Farmer outcome: Marginal farms continue liquidating; mid-tier farms hanging on
4-6 Months (Dec 2026 – Feb 2027)
- Winter demand patterns provide some seasonal support
- Holiday butter/cheese demand peaks
- Prices may test $17.00-17.50/cwt
- Farmer outcome: Some relief, but insufficient for full profitability
6-12 Months (March-August 2027)
- Spring milk production surges (normal seasonal pattern)
- Global dairy competition remains intense
- USDA purchases may exceed budget capacity
- Critical juncture: If prices don’t rise above $17.50, significant farm exits begin
- Farmer outcome: Widespread herd liquidation, consolidation accelerates
12+ Months (2027-2028)
- Structural adjustment through farm consolidation plays out
- Herd size stabilizes at lower level (8.5-9.0 million cows vs. current 9.47 million)
- Remaining farms operate at $17.50-18.00/cwt profitability
- Farmer outcome: Surviving farms are larger, more efficient, fewer in number
Producer Strategies: What Farmers Should Be Doing Now
Individual dairy farmers can’t control milk prices, but they can control costs and risk:
Immediate Actions (September-October 2026)
- Lock in feed costs: Hedge feed prices if commodity costs are stable
- Evaluate herd health: Cull marginal producers to improve average cow quality
- Review debt: Refinance high-interest debt while credit is available
- Defer discretionary capex: Postpone equipment replacement not critical to production
Medium-Term Adjustments (Q4 2026 – Q2 2027)
- Diversify revenue: Expand value-added products (cheese, yogurt, ice cream) if possible
- Explore genetics: Invest in efficiency-improving genetics (feed conversion, somatic cell count)
- Evaluate scale: Assess whether consolidation or partnership makes financial sense
- Monitor costs: Implement real-time cost tracking by enterprise (feed, labor, veterinary)
Strategic Options (2027-2028 timeframe)
- Exit decision: For marginal operations, liquidating and exiting may be financially rational
- Consolidation: Merge with neighboring farms to achieve scale efficiencies
- Niche production: Shift to organic, grass-fed, or other premium segments if feasible
- Vertical integration: Capture downstream value (cheese, yogurt, milk products)
FAQ: Understanding U.S. Milk Futures and Dairy Economics
Q: Why is $16.67/cwt considered low for late August? A: Historically, August and September are typically peak milk supply periods, and prices are seasonally weak. However, $16.67/cwt is still below the 5-year average for late summer ($17.50-18.00/cwt). In strong markets, late August milk trades $18.00-19.00+/cwt. The current level reflects persistent oversupply.
Q: What does CWT stand for, and how does it convert to per-gallon pricing? A: CWT = hundredweight (100 pounds). One gallon of milk weighs approximately 8.6 pounds. So $16.67/cwt ÷ 1.16 (100 lbs ÷ 8.6 lbs per gallon) = approximately $14.37/gallon wholesale equivalent. Retail prices are typically 3-4x wholesale (so $3.50-5.00/gallon retail).
Q: If USDA is buying milk, where does it go? A: USDA purchases go primarily to: (1) Commodity Supplemental Food Program (CSFP) for low-income households, (2) National School Lunch Program, (3) food banks and food service programs, and (4) long-term storage (cheese/milk powder storage for later sale or use). It’s essentially a demand-smoothing mechanism that buys when prices are weak and sells/distributes when markets tighten.
Q: How much is USDA spending on dairy purchases in 2026? A: USDA CCC spending on dairy is currently in the $500-700 million range annually for emergency purchases. This is elevated compared to normal years ($200-300 million), reflecting the severity of oversupply. Budget constraints mean USDA can’t maintain these purchase levels indefinitely if oversupply persists.
Q: Will the government impose quotas or production restrictions? A: Unlikely. The U.S. dairy industry has resisted production controls since the 1980s, and current policy favors market-based solutions. USDA’s approach is demand management (buying excess), not supply restriction. Farmers must make individual liquidation decisions.
Q: What are the chances of a trade deal that opens export markets? A: Uncertain. The U.S. has ongoing trade negotiations with multiple countries (Mexico, China, others), and dairy is often a negotiating point. Export market opening could materially improve prices, but is politically dependent and can’t be counted on for near-term relief.
Q: How do prices at farm-gate differ from futures prices? A: Futures prices are negotiated at the futures exchange (CME in Chicago). Farm-gate prices are what actual farmers receive from milk buyers/cooperatives, typically 3-5% lower than futures prices due to transportation, testing, and handling costs. A farmer selling at farm-gate at $16.67 futures is actually receiving approximately $16.00-16.35/cwt.
Q: Are dairy farmer bankruptcies or farm exits accelerating? A: Yes, modestly. Farm liquidations and consolidations accelerated in 2025-2026, but haven’t reached crisis levels seen in 1985-1986 or 2009. Current trajectory suggests 5-10% of dairy farms may exit annually if prices remain below $17.50/cwt. Larger operations can absorb losses longer than small farms.
Q: Why doesn’t the market reach equilibrium naturally—why does oversupply persist? A: Because milk production is sticky downward. A dairy cow costs $1,500-2,000 and takes 2-3 years to reach full productivity. Once invested, farmers are locked in (sunk costs). Price signals take 18-24 months to affect supply because it takes that long to breed, raise, and bring new cows into production. In the interim, existing cows continue producing regardless of price.
Q: Could higher milk prices destroy demand (like happened with cheese in the 1990s)? A: Yes, but unlikely to be severe. Milk demand is relatively inelastic (people need it for nutrition, use is habitual). If prices rose 10-15%, consumption might decline 2-3%, but wouldn’t collapse. The bigger risk is consumers shifting to dairy alternatives (plant-based milk), which is already happening slowly.
Q: What’s the difference between commodity milk prices and branded/organic milk? A: Commodity milk (what most dairy farmers sell) trades on futures at $16.67/cwt. Organic milk commands a 20-40% premium (roughly $20-23/cwt), and local/branded milk can be 50-100%+ higher. However, organic market is smaller and organic production is more costly, so margins aren’t necessarily better.
Q: Is the dairy industry consolidating? A: Yes, significantly. The number of dairy farms in the U.S. has declined from 60,000+ in 1980 to roughly 30,000 in 2025, while herd sizes have grown from average 40 cows to 315+ cows. This trend will accelerate if prices remain low, as small farms can’t absorb losses and exit or consolidate.
Sources & Publication Note: This analysis synthesizes reporting from Trading Economics and USDA commodity data (August 31, 2026) and contextualizes developments within U.S. dairy economics. Current milk futures prices, dairy production statistics, and USDA CCC program information are available through the CME (Chicago Mercantile Exchange) for price data and USDA NASS for production and herd statistics.