
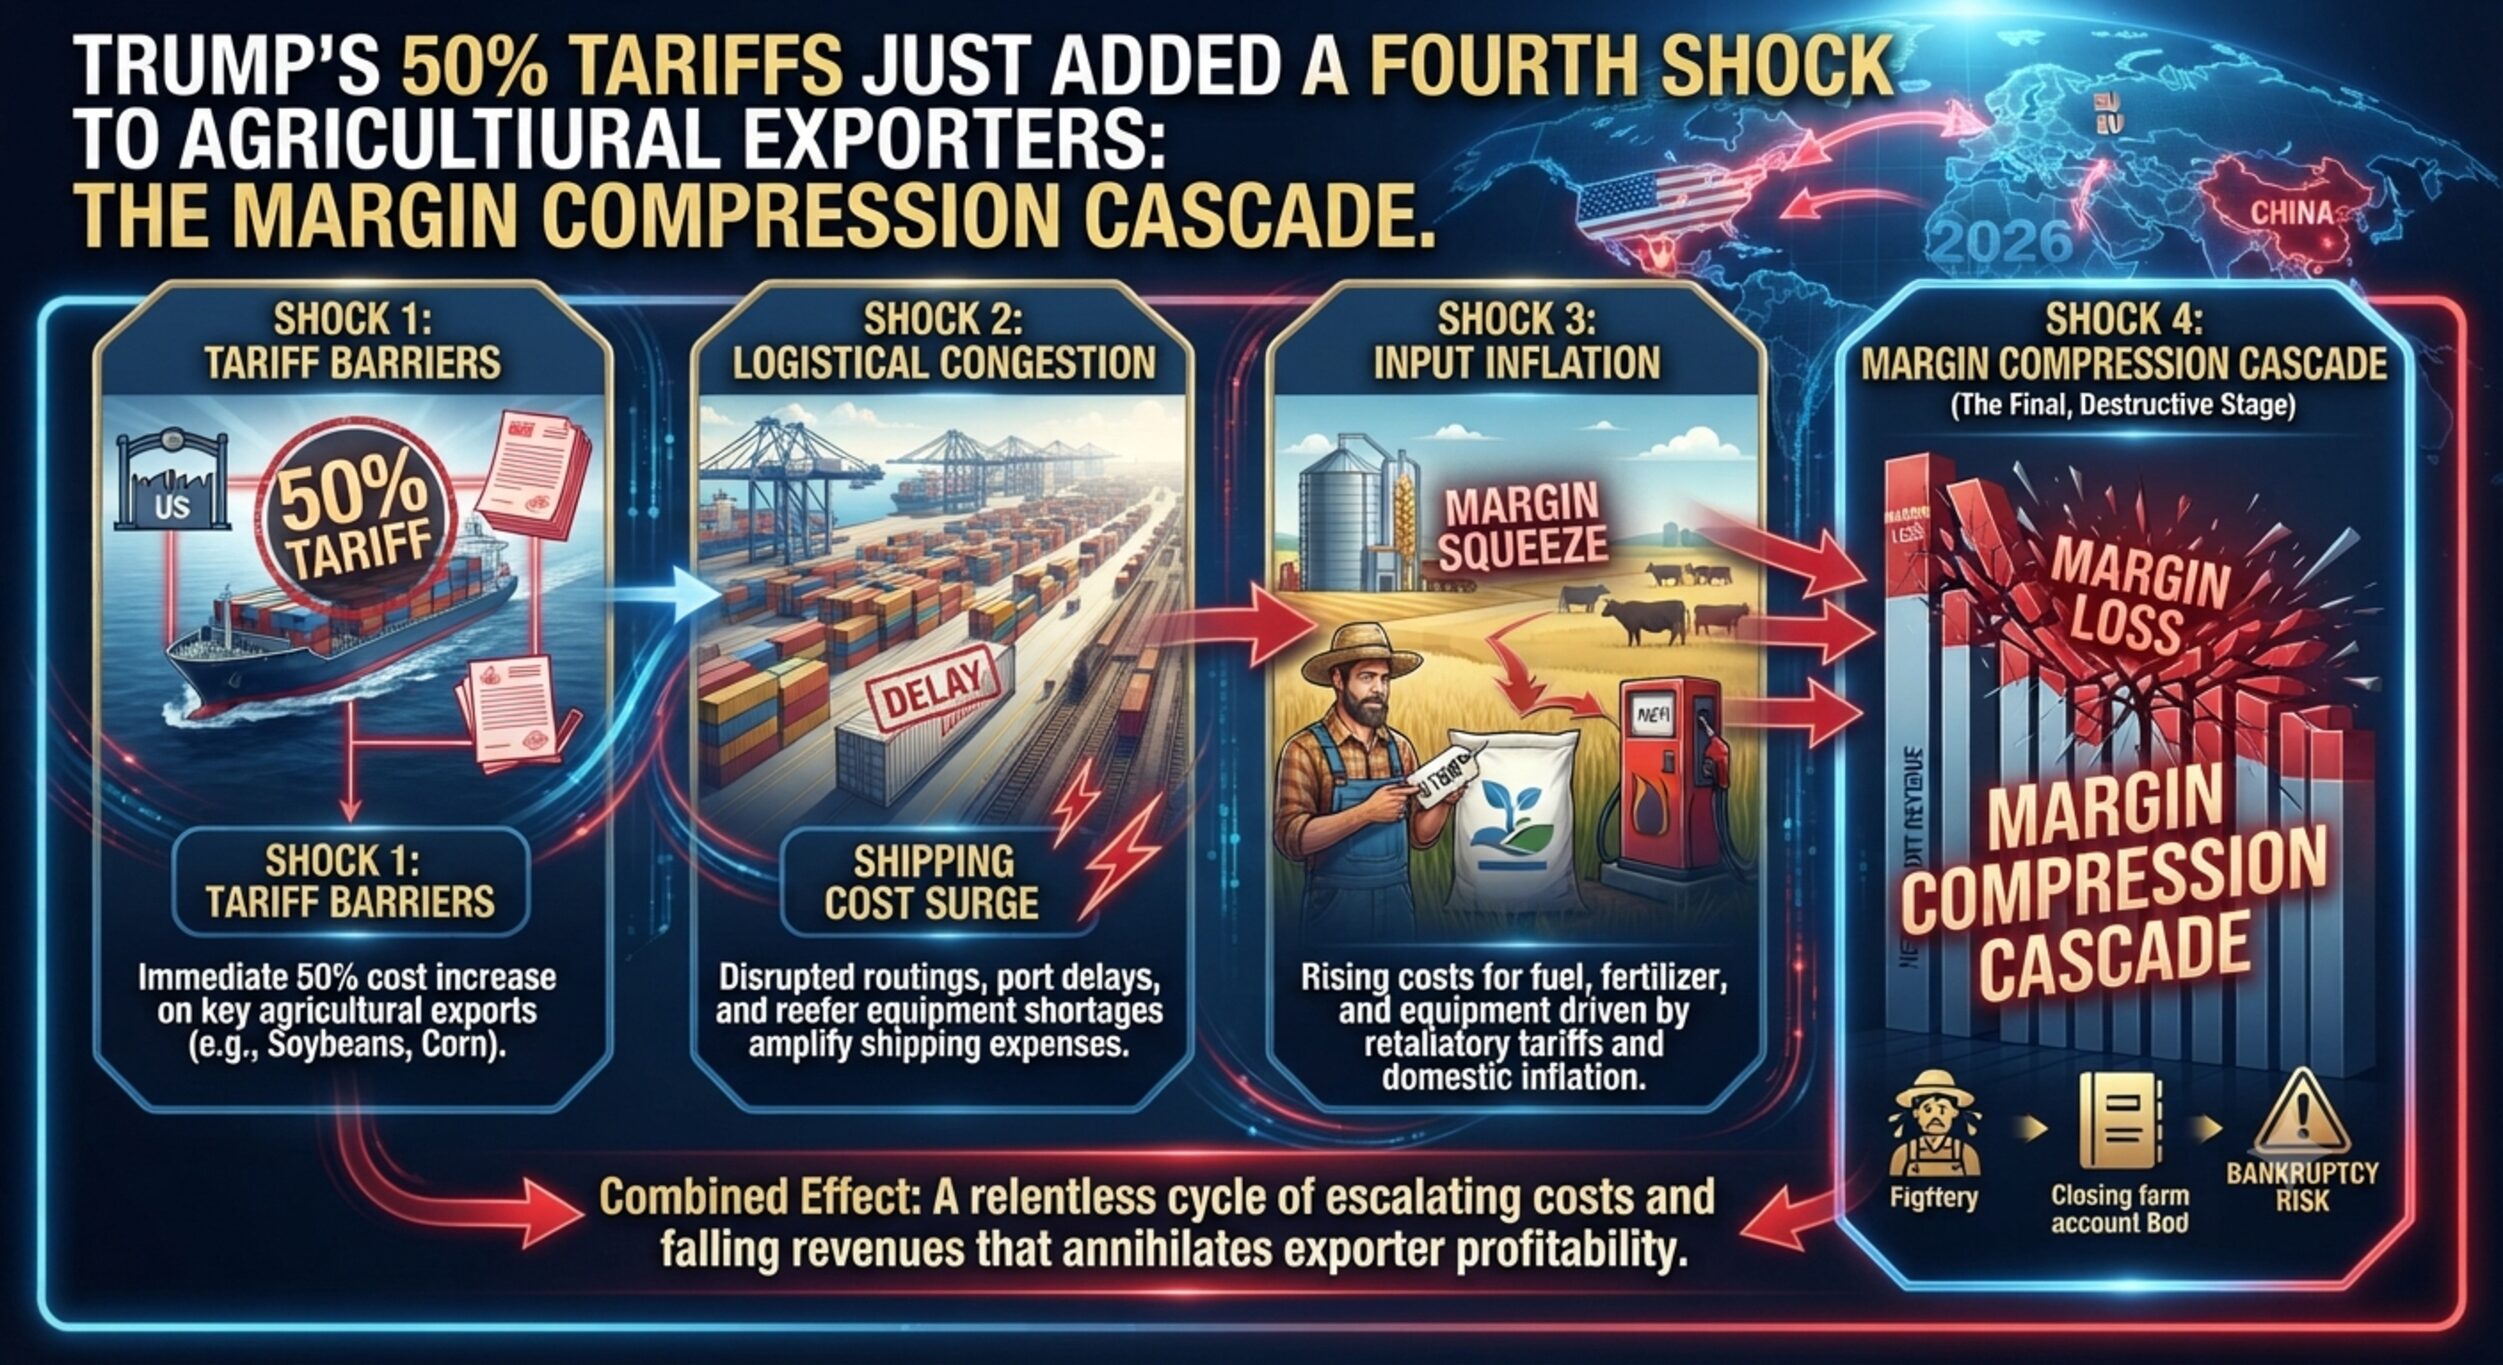
Trump’s 50% tariff escalation on Canadian goods today signals broader trade friction ahead. Combined with Red Sea shipping disruptions, energy volatility, and port congestion, tariffs are now a structural margin pressure for agricultural exporters worldwide—not just North America. Here’s the ripple effect.
Tariffs as a Shipping and Energy Problem, Not Just a Trade Problem
When most observers analyze Trump’s tariff announcement—50% duties on Canadian autos, alcohol, and dairy—they focus on direct trade diversion. Cheaper imports become more expensive; demand shifts; exporters lose market access.
This analysis misses the bigger supply chain shock: tariffs change shipping and logistics dynamics globally.
Here’s how:
Tariff-driven demand volatility creates logistics pressure. When tariffs spike, importers rush to source from alternative origins before rates increase further (front-loading behavior). This creates sudden demand spikes on export corridors that are already stressed by geopolitical disruptions and energy costs.
Alternative sourcing reshapes shipping lane utilization. If tariffs make Canadian exports uncompetitive, importers diversify to Mexico, Brazil, Australia, and South Africa. These alternative routes have different shipping corridor costs, vessel availability, and port congestion profiles. A surge in SA agricultural exports to North America (currently 4% of SA agricultural trade) would immediately collide with Red Sea shipping premiums and Cape Town port bottlenecks.
Trade friction cascades into energy and bunker costs. Tariff uncertainty increases carrier risk premiums and encourages blank sailings (skipped departures) to manage utilization. When capacity tightens, fuel efficiency matters less and fuel surcharges rise faster. Bunker adjustment factors (BAF)—already at $400–$700 per FEU due to Iran war disruptions—will spike further if tariff-driven demand volatility reduces vessel utilization predictability.
In short: tariffs don’t just reduce trade volume. They increase logistics costs for alternative sourcing corridors and compress margins globally.
The Global Shipping and Energy Backdrop: Four Structural Pressures
To understand why tariffs matter now, you need the shipping context.
Red Sea Route Disruptions (Ongoing)
Container rates bifurcated in 2025–2026. Transpacific routes normalized to $1,800–$2,400 per FEU, but Asia-Europe rates remain locked at $3,500–$4,500 per FEU—more than double pre-disruption levels. Houthi attacks force reroutes around the Cape of Good Hope, adding 10–14 days to transit and consuming vessel capacity system-wide.
Industry consensus: diversions will persist through at least 2027. This is a structural constraint on global shipping capacity and a permanent cost floor for exporters serving Europe.
Energy Volatility and Bunker Fuel Shock (Recent Escalation)
In early 2026, the Iran war and Strait of Hormuz blockade spiked oil prices sharply. Bunker fuel (marine diesel) hit $600–$650 per metric ton for Very Low Sulfur Fuel. This translated directly to freight surcharges: BAF now accounts for $400–$700 of every FEU quote.
Fuel is up to 40% of total carrier operating expenses. Over the past four months, transpacific rates jumped from ~$1,800 to ~$4,200 per container—with fuel being the dominant driver.
More critically: fuel price volatility now moves faster than base rate cycles. Tariff uncertainty will increase oil price volatility (geopolitical risk premium), which will immediately pass through to bunker costs and BAF surcharges.
Structural Container Overcapacity (Paradoxical Tightness on Key Routes)
Between 2020 and 2023, carriers ordered over 800 new container ships (7+ million additional TEUs). These were delivered into 2024–2026, creating structural oversupply reflected in a 31.6% order book-to-fleet ratio—highest since 2016.
Yet this global overcapacity masks acute route-specific tightness. Red Sea diversions absorb capacity that would otherwise serve transpacific and intra-Asia routes. When tariff-driven demand shifts push shipper volume onto already-congested corridors, carriers can’t easily add capacity (all newbuilds are deployed; older ships are being scrapped). Result: spot rates spike on those lanes even as system-wide overcapacity persists.
Port Congestion in Key Export Hubs
Domestic port efficiency is the final constraint. Cape Town (South Africa), Shanghai (China), Rotterdam (Europe), and LA/Long Beach (US) all experience periodic congestion. Demurrage (per-day terminal dwell charges) and detention (per-day container rental) stack fastest on perishable goods and time-sensitive shipments.
Tariff-driven demand shifts will concentrate volume on specific export corridors during specific windows (front-loading before rate increases), overwhelming port capacity and creating cascading demurrage and inventory carrying costs.
How Tariffs Amplify Shipping and Energy Pressures: The Regional Case Study
South Africa provides a concrete example of how tariff shocks ripple through interconnected supply chain systems.
SA agricultural exports reached $3.7 billion in Q1 2026, up 11% year-on-year. However, grower financial conditions deteriorated due to Cape Town port congestion and elevated shipping costs—evidence that volume growth doesn’t translate to margin recovery when logistics costs are rising.
Now add tariff pressure:
Current SA agricultural market exposure:
- Africa: 44% of exports
- European Union: 26%
- Asia/Middle East: 14%
- North America: 4%
Tariff-driven demand shift scenario: If Trump’s escalation triggers broader agricultural tariffs or retaliatory measures, North American importers will seek alternatives. SA’s competitive advantage in grapes, apples, citrus, and stone fruit makes it a natural destination for diverted demand.
The margin math:
- Increased volume to North America (requires faster routing, likely air freight components, or premium ocean service)
- Cape Town port congestion (already eroding margins; surge in volume + demurrage = margin collapse)
- Red Sea premiums (if North American-bound shipments transit Asia-Europe routes before transshipping, they hit $3,500–$4,500/FEU Asia-Europe rates)
- Bunker volatility (tariff uncertainty increases oil price volatility → BAF surcharges spike)
Result: SA exporters face a paradox—demand increases, but profitability decreases—because the logistics system to serve that demand is already stressed.
Buyer and Procurement Implications for Global Supply Chains
For procurement and sourcing teams diversifying away from tariff-exposed origins:
- Plan for logistics cost escalation, not just unit price reduction. When shifting sourcing to alternative origins (SA, Mexico, Brazil, India), factor in route-specific shipping premiums. Transpacific is oversupplied ($1,800–$2,400/FEU); Asia-Europe is constrained ($3,500–$4,500/FEU). Choose origins aligned with available shipping capacity and routes.
- Lock shipping contracts before tariff-driven demand surge. Tariff announcements create immediate front-loading behavior. If tariffs take effect in 60–90 days, shippers rush to secure capacity within weeks. Lock annual contracts on stable routes now; avoid entering the market during the surge window.
- Quantify tariff risk in total landed cost (TLC) models. Don’t assume tariffs remain at 50%. Political escalation could drive rates higher; retaliatory tariffs could close markets entirely. Build scenario models with +10%, +25%, +50% tariff levels and corresponding demand shifts.
- Treat bunker fuel as a separate negotiation variable. BAF surcharges are now $400–$700/FEU and volatile. Negotiate fuel price triggers that allow you to adjust committed volumes if bunker prices spike beyond agreed thresholds. Don’t accept fixed BAF rates in multi-year contracts.
For exporters in tariff-exposed and tariff-beneficiary regions:
- Develop dual-route logistics strategies. If your primary market faces tariffs, identify secondary routes and carriers serving those corridors. Red Sea uncertainty means you need carrier and routing diversity; tariff uncertainty means you need market diversity.
- Quantify port congestion as a margin determinant. For perishables, demurrage costs ($50–150/container/day) + cold storage ($100–200/day) + spoilage risk = real margin erosion. Invest in port efficiency; if domestic ports are congested, identify alternative export hubs (Durban, Transshipment ports) and factor additional logistics costs into forward pricing.
- Price for margin, not volume. The temptation during tariff-driven demand shifts is to chase volume by discounting. Resist this. Rising logistics costs (shipping, fuel, port congestion) mean margin recovery is harder. Lock premium pricing for new market access; volume can follow once logistics stabilize.
Related
FAQ: Tariffs, Shipping, Energy, and Global Margin Compression
How do tariffs affect shipping costs if tariffs are a trade tax, not a shipping tax?
Tariffs change shipper behavior and demand volatility, which changes how carriers deploy vessels and price capacity. Front-loading (rushing shipments before tariff increases) creates temporary demand spikes on specific routes, tightening capacity and raising spot rates. Uncertainty around tariff timing and retaliation increases carrier risk premiums (reflected in higher BAF and emergency surcharges). Additionally, tariff-driven demand shifts send volume to alternative origins with different shipping route costs—some routes may be already constrained (Asia-Europe at $3,500–$4,500/FEU), amplifying cost pressures on exporters serving tariff-beneficiary markets.
Will Red Sea shipping rates fall if tariffs disrupt demand?
Unlikely in the near term. Industry consensus is that Red Sea diversions will persist through at least 2027 regardless of tariff developments. If tariff-driven demand destruction is severe enough to reduce global shipping volume significantly, spot rates could soften. However, carriers manage utilization through blank sailings (skipped departures), which tighten capacity and support prices. More likely scenario: Red Sea premiums stay elevated ($2,000–$3,000/FEU above pre-disruption) through 2027, with spot volatility from tariff-driven demand shocks layered on top.
Should exporters raise prices to recover margin erosion from tariffs and shipping costs?
Not directly, and not immediately. Most commodity and agricultural exporters are price-takers on global benchmarks—they cannot unilaterally raise prices without losing volume to competitors. Instead, focus on cost control: negotiate shipping contracts aggressively, optimize port efficiency, diversify routing and carriers to hedge geopolitical risk, and lock forward contracts at premium prices only when you have differentiated product or market access advantage. For differentiated products (specialty crops, premium brands), tariff-driven supply constraints may create pricing opportunity—but this is market-specific, not universal.
What should supply chain teams do right now to prepare for tariff escalation?
(1) Lock annual shipping contracts on stable routes (transpacific $1,800–$2,400/FEU) within the next 30–60 days, before tariff-driven front-loading tightens capacity. (2) Develop alternative sourcing scenarios with route-specific shipping costs and tariff assumptions. (3) Negotiate fuel price triggers into shipping contracts; don’t accept fixed BAF. (4) Identify secondary export routes and ports if your primary routes face tariff exposure. (5) Build 2–3 week logistics buffer windows for seasonal and tariff-driven congestion spikes.
Is port congestion a bigger risk than shipping rates for perishable exporters?
For perishables, yes. A 1–2 day delay in port clearance can erase shipment profitability through cold storage costs, spoilage, and missed market windows. Demurrage alone costs $50–150/container/day; add cold storage and the math is brutal. Port efficiency is a binary constraint on margin recovery. If your primary export port is congested (e.g., Cape Town), identify alternative ports (Durban, transshipment hubs) and factor additional logistics costs into pricing models now.
Sources
| Source | Publication Date | Focus Area | Key Data Point |
|---|---|---|---|
| Trump Imposes 50% Tariffs on Canadian Goods | July 21, 2026 | US trade policy, tariff escalation signal | 50% tariffs on autos, alcohol, dairy; signals broader trade friction escalation |
| Container Shipping Forecast 2026: Rates, Routes and Risks | May 21, 2026 | Market normalization, Red Sea risk, order book dynamics | Red Sea $3,500–$4,500/FEU (vs. $1,200–$1,500 pre-disruption); diversions likely through 2027; order book 31.6% |
| 2026 Freight Market Outlook: Container Rates, Capacity, and Strategy | January 3, 2026 | Contract rates, capacity dynamics, shipper leverage | Transpacific $1,800–$2,400/FEU; Asia-Europe $3,500–$4,500/FEU (spot); BAF $400–$700 |
| Oil Prices and Container Shipping Costs | July 2026 (5 days ago) | Fuel shock, vessel efficiency impact, Iran war disruption | Transpacific rates jumped $1,800→$4,200 in 4 months; fuel cost $155→$269/TEU (new), $360→$626/TEU (old) |
| Economic Factors Affecting Shipping Industry Costs in 2026 | March 25, 2026 | Fuel, crew costs, regulatory compliance | Bunker fuel $600–$650/MT; fuel up to 40% of carrier operating expenses |
| Shipping Costs Surge as Fuel Prices Hit Near-Record Highs | June 29, 2026 | Geopolitical energy disruption, carrier cost pass-through | Transpacific rates jumped $1,800→$4,200 in 4 months; tariffs signal trade friction escalation |
| Container Shipping Rates in 2026: Fertilizer Impact | January 30, 2026 | Seasonal logistics, commodity crowding | Front-loading creates logistics stress; surcharges spike when equipment/labor stretched; demurrage/detention fees compound |
| South Africa Agricultural Exports Rise Despite Port Bottlenecks | May 31, 2026 | Regional agricultural growth, logistics constraints | Q1 2026: +11% YoY to $3.7B; Africa 44%, EU 26%, Asia/ME 14%, Americas 4% |
| SA’s Farm Exports Jump 11% Despite Port Bottlenecks | May 26, 2026 | Port efficiency, grower financial impact | Cape Town congestion eroding grower margins despite volume growth; demurrage stacks fast on perishables |
| Commodity Trade in 2026: How Logistics Bottlenecks Drive Price Volatility | February 25, 2026 | Agricultural pricing, FOB+freight mechanism | FOB + freight = CIF; tariff-driven demand shifts compress margins via logistics cost escalation |
| South Africa’s Agriculture Enters a Critical Month | April 12, 2026 | Crop forecast, input costs, export logistics | Citrus +3–5%; Middle East access difficult; fuel prices, shipping costs, logistics challenges top-of-mind |
| Rising Fuel Costs Complicate Trans-Pacific Shipping Contracts | April 15, 2026 | Bunker price impact, BAF negotiations, tariff uncertainty | Iran war disruption; bunker prices doubled; BAF + emergency surcharges emerging amid trade uncertainty |

