
June 9, 2026
Global Food And Beverage Transportation and Shipping Industry is valued at approximately USD 187–318 billion in 2026, growing at a CAGR of 4–8.3% depending on scope, projected to reach USD 258–489 billion by 2032–2036. The maritime freight transport market — within which food and beverage commands nearly 33% of total container shipping volume — is valued at USD 632.36 billion in 2026, growing at a 5.43% CAGR toward USD 823.57 billion by 2031. Road freight carries approximately 70% of food logistics volume globally; ocean freight handles the largest share of cross-border food trade by volume; air freight serves the most time-critical and highest-value perishable movements; and rail increasingly provides the decarbonisation corridor that regulators and food companies are demanding.
Transportation and shipping is the connective tissue of the global food and beverage value chain. Nothing reaches a consumer without moving — grain from the farm to the mill, ingredients from the processor to the manufacturer, finished goods from the factory to the distribution centre, products from the warehouse to the retailer, and increasingly, individual orders from the micro-fulfilment centre to the consumer’s doorstep. Every mode of transport — ocean, road, rail, air, and inland waterway — plays a specific role in the food and beverage supply chain, and in 2026 each is being simultaneously reshaped by the same set of extraordinary forces: geopolitical disruption, digital technology, sustainability regulation, and the structural shift in global trade patterns driven by US tariff policy and nearshoring trends.
The single most consequential development in global shipping for the food and beverage industry in 2026 is the evolution of the Red Sea crisis and the cautious return of container shipping to the Suez Canal route. For over two years, the Houthi attacks on commercial vessels in the Red Sea forced virtually every major container line to reroute around the Cape of Good Hope — adding 10–14 days to standard Asia-Europe transit schedules, increasing fuel consumption by approximately 30%, and creating the effective equivalent of a 20% reduction in global shipping capacity as the world’s fleet spent significantly more time at sea. For food and beverage supply chains — where shelf-life constraints, seasonal produce windows, and just-in-time production schedules all depend on predictable transit times — this has been a profound and costly disruption.
This report provides the most comprehensive publicly available analysis of the global transportation and shipping industry in 2026 from the perspective of the food and beverage value chain — covering ocean freight, road freight, rail and intermodal, air cargo, the reefer container revolution, technology and digitisation, geopolitical disruption, US tariff impacts, sustainability and decarbonisation, regional dynamics, key challenges, strategic outlook, and leading companies.
Executive Summary: The 2026 F&B Transportation Landscape
The global transportation and shipping industry serving the food and beverage value chain in 2026 is defined by a single overarching challenge: building resilient, flexible, and sustainable supply chain networks in an operating environment where disruption has become the permanent baseline condition rather than the exceptional event.
Key Takeaways for Stakeholders:
The global food logistics market is valued at USD 187–318 billion in 2026, growing at a CAGR of 4–8.3% toward USD 258–490 billion by 2032–2036. Temperature-controlled transportation leads with 47% of the food logistics segment, and dairy products logistics maintains the largest application share at 55%.
Food and beverage commands nearly 33% of total container shipping volume globally — making it the single largest cargo category in ocean freight.
The Red Sea crisis has structurally reshaped Asia-Europe shipping. The Cape of Good Hope rerouting that began in January 2024 has effectively cut global shipping capacity by 20% and added 10–14 transit days to standard Asia-Europe routes. In February 2026, the ME11 service became one of the first to resume Suez Canal transits in a cautious, phased return.
Container overcapacity is the defining structural challenge in ocean freight. Global container capacity expanded 27% between September 2022 and September 2025, while cargo volume grew only 8.5%. The Suez Canal’s eventual full reopening risks releasing 6% of additional fleet capacity back into an already oversupplied market.
US tariffs are reshaping global F&B trade flows. US tariffs — particularly targeting imports from China — are forcing food manufacturers to restructure procurement and distribution networks, accelerating nearshoring, and creating significant new logistics complexity.
Hapag-Lloyd acquires ZIM for USD 4.2 billion, adding 700,000 TEU to its fleet and consolidating its position as the world’s 5th largest container line.
In ocean and air freight, 2026 marks a divergence: ocean freight faces excess supply shifting negotiating power toward shippers; air cargo remains relatively stable with seasonal and event-driven fluctuations.
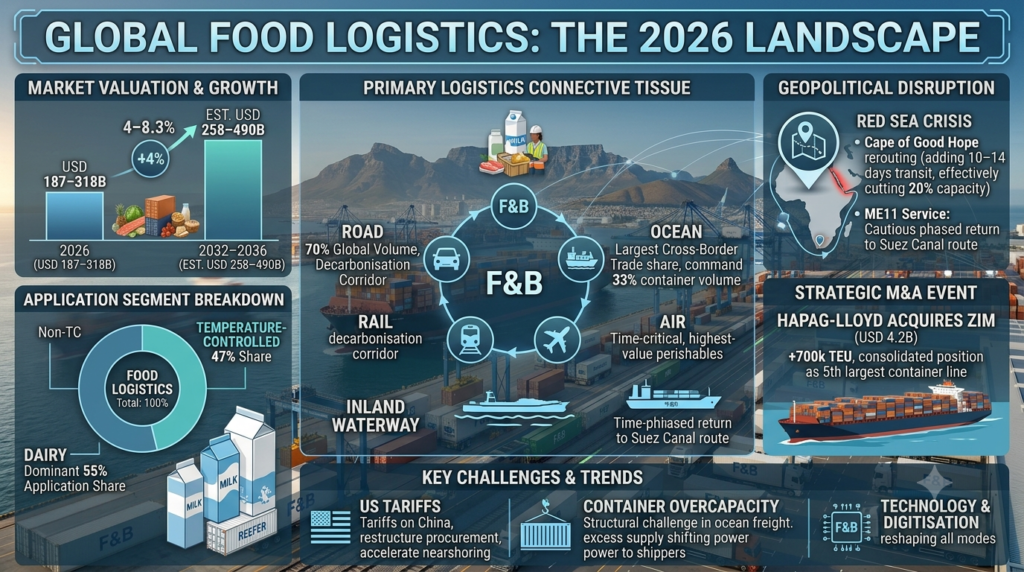
Table of Contents
1. Market Overview: The F&B Transportation Universe
Defining the F&B Transportation Market
The food and beverage transportation and shipping market encompasses every mode and service used to move food and beverage products through the global value chain — from agricultural commodity shipping at origin, through ingredient and raw material transport, through finished goods distribution, through export/import international trade, through domestic distribution, and through last-mile delivery to consumers and foodservice operators.
The market segments by mode: road freight (70% of food logistics volume, dominant for domestic and regional distribution), ocean freight (the backbone of international food trade, handling the largest volume of food commodities by tonnage), rail and intermodal (growing in importance for long-haul, lower-carbon freight movements), air cargo (premium service for time-critical perishables, high-value ingredients, and emergency supply chain substitution), and inland waterway (important in Europe and parts of Asia for bulk food commodity movements).
The global food logistics market is estimated at approximately USD 318 billion in 2025, valued at USD 187–318 billion in 2026 depending on scope, growing at CAGR of 4–8.3% toward USD 258–489 billion by 2032–2036. Temperature-controlled transportation services account for 47% of the product segment in 2026, reflecting the dominant role of cold chain logistics in food transportation value. Dairy products logistics maintains the largest application share at 55% in 2026, driven by strict temperature control demands, high shipment frequency, and short shelf-life requirements.
The Food Logistics Value Hierarchy
Understanding the F&B transportation market requires appreciating the distinct logistics requirements at each stage of the value chain:
Agricultural and commodity transport — bulk grain, oilseeds, sugar, coffee, cocoa, and other agricultural commodities move primarily by bulk vessel in ocean freight, with domestic agricultural movements dominated by road freight and rail in major agricultural exporters (US, Brazil, Australia, Canada, Argentina, Ukraine).
Ingredient and raw material distribution — processed agricultural inputs (flour, sugar, vegetable oils, dairy ingredients, protein concentrates) move in containerised ocean freight for international trade and road/rail for domestic supply.
Finished goods manufacturing to distribution — food and beverage finished goods represent the largest volume segment of containerised food trade globally, moving in both ambient and refrigerated containers.
Retail and foodservice distribution — domestic food distribution from regional distribution centres to retail stores, foodservice operators, and e-commerce fulfilment points is dominated by road freight.
Last-mile consumer delivery — the fastest-growing and most cost-intensive segment, encompassing home grocery delivery, meal kit delivery, and quick commerce.
2. Ocean Freight: The Backbone of Global F&B Trade
Market Scale and Structure
The maritime freight transport market is valued at USD 632.36 billion in 2026, growing at a 5.43% CAGR toward USD 823.57 billion by 2031. Food and beverage represents approximately 33% of total container shipping volume — the largest single cargo category in ocean freight. The global container fleet expanded 27% between September 2022 and September 2025, while cargo volume grew only 8.5% over the same period, creating a structural overcapacity condition that is reshaping pricing dynamics in favour of shippers.
The container shipping market is consolidating through a wave of M&A. Hapag-Lloyd’s acquisition of ZIM Lines for USD 4.2 billion adds approximately 700,000 TEU to its global fleet capacity, helping it surpass the 3 million TEU milestone and consolidate its position as the world’s 5th largest container shipping line — moving closer to COSCO at number 4 with 3.6 million TEU and increasing the margin to number 6, ONE, with 2.1 million TEU.
The new Gemini Alliance between Maersk and Hapag-Lloyd has promised customers an arrival reliability of 90% — far higher than the industry average — representing a competitive differentiator for food and beverage shippers who depend on schedule reliability for production planning and shelf-life management.
The Reefer Container Market
Reefer containers — refrigerated shipping containers capable of maintaining temperatures from −35°C to +30°C — are the critical ocean freight infrastructure enabling the global trade of fresh produce, frozen meat and seafood, dairy products, and temperature-sensitive beverages. The global reefer container fleet is dominated by Maersk, MSC, CMA CGM, and Hapag-Lloyd, which together operate the majority of the world’s reefer container capacity.
Reefer containers are vital for trading food products globally. At the same time, they are also an important source of emissions and contribute notably to the 140 million tonnes of CO2eq annual emissions released by the container shipping industry, due to the use of harmful refrigerants and the high energy consumption of conventional reefer units. The International Climate Initiative is training reefer technicians and piloting climate-friendly containers using R290 — a hydrocarbon refrigerant with a global warming potential of under 0.1 and zero ozone depletion potential.
Food and agriculture broadly experiences a moderate impact from the Red Sea disruptions. Perishable goods and time-sensitive commodities — fresh produce, dairy, meat — are affected by longer transit times. Some reefer cargo has shifted to air freight or alternative sourcing. Shelf-life constraints make the extra 10–14 days critical: a fresh strawberry, a premium tuna, or a chilled dairy product with a 30-day shelf life cannot absorb 14 additional transit days without significant quality compromise.
The Red Sea Crisis and Suez Canal Return
The defining geopolitical event for global ocean freight in 2024–2026 has been the Houthi attacks on commercial shipping in the Red Sea — which began in late 2023 and forced virtually every major container line to reroute around the Cape of Good Hope from January 2024 onward. About 30% of global container trade normally passes through the Red Sea and the Suez Canal. The attacks pushed container spot rates from Asia to Europe nearly five-fold compared with early-December 2023 levels, according to J.P. Morgan Research.
In 2026, a phased return to the Red Sea is underway. Maersk completed a successful MECL1 test voyage via the Suez Canal in December 2025, and in mid-February 2026, the ME11 service resumed Suez Canal transits in a deliberate step toward reintegrating this historic route. In its Winter 2026 market update, Maersk noted: “The transition back to trans-Suez shipping will indeed be a significant one for the entire industry and complete immunity to disruption is unlikely.”
However, a rapid return to the Suez Canal route carries its own significant supply chain risk. The return effectively releases roughly 6% of global fleet capacity back into the market — combined with new vessel deliveries already creating overcapacity, this could drive freight rates down significantly. Additionally, vessels taking the faster Suez route will arrive in Europe at the same time as vessels that took the longer Cape route, potentially causing massive port congestion for 2–3 weeks and giving importers multiple months of inventory in one simultaneous arrival, subsequently driving inventory-to-sales ratios higher.
For food and beverage shippers, the strategic advice from Maersk’s Winter 2026 update is clear: “The experience and insights gained from previous events will enable us to mitigate some of the disruption and safeguard customers’ supply chains. There is no doubt that there will be added volatility to supply chains once container liners begin the shift back to East-West transits through the Red Sea.”
Container Overcapacity: A Buyer’s Market in Ocean Freight
“Between September 2022 and September 2025, global container shipping capacity has increased by 27%. The growth in cargoes over that same period is only 8.5%.” This structural mismatch between capacity supply and cargo demand is creating a sustained buyer’s market in ocean freight — particularly on the major fronthaul trades from Far East to North Europe and Mediterranean, where average long-term rates entering validity in early 2026 were down 25% on the Mediterranean trade and 10% on North Europe trade compared to end-2025 levels.
In ocean freight, greater capacity is expected to shift negotiating power toward shippers. For food and beverage companies with significant ocean freight volumes, 2026 represents an opportunity to lock in competitive long-term contracts while the market balance strongly favours buyers. In air freight, market indicators suggest a more stable environment, with seasonal and event-driven fluctuations.
3. Road Freight: The Dominant F&B Distribution Mode
Market Leadership and Scale
Road freight carries approximately 70% of food logistics volume globally, providing the flexible, door-to-door delivery capability that ocean, rail, and air freight cannot replicate for domestic and regional food distribution. Every food and beverage product that reaches a retail shelf, foodservice operator, or consumer doorstep almost inevitably involves road freight for at least the final leg of its journey.
The US alone operates over 45,000 retail bakeries and food processing facilities that depend on road freight networks for inbound ingredient receipt and outbound finished goods distribution. Approximately 65% of American households consume packaged food products that were transported by refrigerated road freight in the 48 hours before purchase.
The global food-grade liquid bulk transportation market — encompassing the specialised tanker trucks and ISO tanks used to transport edible oils, liquid dairy ingredients, wine, spirits, and beverage concentrates — is projected to grow from approximately USD 15 billion in 2025 to USD 23 billion by 2033 at a CAGR of 6.2%.
The Road Freight Technology Revolution
Road freight for food and beverage is undergoing a profound technology transformation driven by three forces: digital visibility platforms providing real-time shipment tracking and exception management; AI-powered route optimisation reducing fuel consumption and improving delivery reliability; and the emergence of electric heavy goods vehicles that are beginning to address the carbon intensity of diesel road freight.
IoT sensors transmitting temperature and location data every 1–5 minutes are now the baseline expectation for any reefer truck serving pharmaceutical, premium food, or regulated fresh food categories. Compliance requirements under FSMA for temperature documentation of certain food categories are accelerating technology adoption across the food road freight sector.
Tariffs and Cross-Border Road Freight
US tariff policy is having direct, measurable impacts on cross-border North American road freight. Canada and Mexico — the US’s two largest trading partners — have seen reduced shipment volumes in tariff-affected categories. Cross-border trucking takes a hit when tariff increases shift freight away from cross-border lanes and toward domestic alternatives. Higher import costs flow directly into retail prices; when consumers pull back, retailers order fewer goods, and fewer goods mean fewer truckloads.
Nearshoring — moving production closer to end markets to reduce cross-border tariff and logistics risk — is generating new domestic road freight demand, but this nearshoring-driven freight growth has not yet fully counteracted the freight lost to tariffs, reduced imports, and global consumer caution.
4. Rail and Intermodal: The Decarbonisation Corridor
Rail’s Role in F&B Transportation
Rail freight carries a significant share of bulk food commodity movements globally — grain, sugar, edible oils, flour, and processed food ingredients all move extensively by rail in the US, Europe, Russia, China, Australia, and Canada. In the US, 52% of rail freight car loads consist of bulk commodities including agriculture and food products. Rail intermodal traffic tripled in the US between 1980 and 2002, and rail’s role in food distribution continues to grow as decarbonisation pressure shifts long-haul food freight away from road.
The sustainability case for rail over road is compelling: rail is 3–4 times more fuel-efficient than trucks, translating to lower cost-per-ton-mile for long-haul movements and an estimated 75% emission benefit for conventional rail over trucking. For food and beverage companies with ambitious Scope 3 emissions reduction targets — where road freight often represents the largest single logistics emission category — modal shift from road to rail is the highest-impact decarbonisation lever available.
The China-Europe Rail Corridor
The China-Europe Railway Express — connecting Chinese manufacturing centres with European markets in 18–22 transit days (compared to approximately 35–40 days by sea via Suez, and 50+ days via Cape of Good Hope) — has emerged as a commercially significant alternative routing for food and beverage goods during the Suez Canal disruption period. For mid-weight, shelf-stable food and beverage products that can tolerate 18–22 day transit times, the China-Europe rail corridor offers a transit time advantage over Cape of Good Hope routing while remaining significantly more cost-effective than air freight.
Intermodal Innovation
Intermodal freight movement — using standardised containers that transfer seamlessly between ship, rail, and truck without cargo rehandling — is the foundation of modern food and beverage international logistics. The development of refrigerated intermodal containers that maintain temperature integrity across the full multimodal journey is enabling the cold chain to extend seamlessly from ocean freight through rail to final road delivery without temperature excursion risk.
Intermodal hubs — dedicated facilities where containers transfer between rail and truck — are being developed at scale across Europe and Asia as part of both commercial efficiency investment and regulatory pressure to shift freight from road to rail. The EU’s Fit for 55 package is creating direct incentives for freight modal shift that are beginning to reshape European food supply chain network design.
5. Air Cargo: Premium Speed for Perishables and Emergencies
Air Freight’s Role in F&B
Air cargo accounts for a small fraction of food and beverage volume but a disproportionate share of value — premium fresh seafood, exotic fruits, cut flowers, high-value wines and spirits, specialty cheeses, and time-critical pharmaceutical ingredients all depend on air freight for the speed that their value density and shelf life constraints require.
Air freight is also the food supply chain’s emergency option. When ocean freight disruptions — the Suez Canal closure, port congestion, Red Sea attacks — threaten to create shelf-life-critical delays, food companies frequently deploy air freight as an emergency substitution, accepting the cost premium to protect production schedules and customer commitments.
Within air freight, Asia-Europe markets have remained under sustained pressure in 2026 as the Middle East situation continues to restrict key transit corridors. With roughly one-third of Asia-Europe air capacity normally routed through the Middle East, the ongoing disruption in the region has significantly reduced available uplift and created wider operational unpredictability across the air freight market. Maersk has assembled a suite of alternative air and multimodal solutions including secured lift via non-Gulf gateways, Sea-Air combinations via Colombo and Oman, and expanded landbridge connections across Saudi Arabia and the UAE.
War-risk insurance premiums for transiting certain regions have surged by up to 1,000% in some areas, making certain routes prohibitively expensive for standard food shipments and pushing traffic toward alternative corridors with higher congestion.
Sea-Air: The Hybrid Solution
The Sea-Air model — shipping cargo by ocean to a hub in the Middle East, Southeast Asia, or South America, then transferring to air freight for the final high-speed leg — is growing in commercial importance as a cost-efficient compromise between pure ocean freight’s low cost and pure air freight’s speed. For food and beverage categories that require faster-than-ocean delivery but cannot justify full air freight costs, Sea-Air via hubs like Dubai, Singapore, Colombo, and Muscat is enabling viable transit times at a meaningful cost discount to pure air.
6. US Tariffs: The Trade Policy Earthquake Reshaping F&B Logistics
The Scale of Disruption
The US tariff landscape in 2026 — including substantial tariffs targeting imports from China, the EU, Canada, and Mexico under various Section 232, Section 301, and executive order authorities — represents the most significant structural disruption to global F&B trade flows since the COVID-19 pandemic. For the food and beverage sector, the impacts are multidimensional and cascading.
US canned products such as tomato paste, beans, fruit cocktails, and canned meat faced stiff competition in international markets where US goods had previously enjoyed tariff-free access, as retaliatory tariffs from Canada, Mexico, the EU, and China created new barriers for US food exports. These trade restrictions forced American processors to redirect surplus inventory into the domestic market, increasing competition and price pressures at home while eroding established export relationships.
For companies sourcing food ingredients from China — including amino acids, botanical extracts, mineral supplements, and food additives — the 25% tariffs are creating direct cost increases that cannot be absorbed without either margin compression or consumer price increases.
Nearshoring and Supply Chain Restructuring
The strategic response to tariff risk across the food and beverage industry is accelerating nearshoring — moving production and sourcing closer to primary end markets. Goods trade and greenfield FDI crossed their longest average distances on record in 2025, while the shares of these flows occurring within major geographic regions fell to new lows. Whether nearshoring strategies will ultimately lead to more regionalised business patterns remains to be seen.
Alternatives to tariff-exposed long-haul shipping routes include Cape of Good Hope routing for ocean freight, transpacific routing to US West Coast with domestic rail/truck onward movement, sea-air combinations through alternative hubs, the China-Europe Railway Express corridor, and nearshoring to reduce dependence on long-haul ocean routes entirely.
Consider nearshoring or reshoring to reduce dependence on international shipping and avoid geopolitical risks, DHL advises. Diversification not only helps reduce tariff exposure but also enhances resilience against other disruptions. US businesses that find fast-growing global trade corridors, stay ahead of evolving compliance and tariff requirements, and rely on trusted, data-driven insights will be better positioned to expand and grow.
7. Technology and Digitisation: The Intelligent F&B Supply Chain
Real-Time Visibility as Standard
The digitalisation of food and beverage transportation management is advancing rapidly, driven by regulatory compliance requirements (FSMA, DSCSA), customer demand for real-time supply chain visibility, and the commercial value of data in a disruption-prone operating environment. Real-time tracking, temperature monitoring, estimated time of arrival prediction, and exception alerting are transitioning from premium features to baseline expectations across every mode of food transport.
In 2026, both ocean and air freight must navigate a myriad of challenges. Beyond the potential re-opening of the Suez Canal and cost-efficient emission-reduction policies, businesses must also consider geopolitical headwinds from potential US tariff changes. Technology is the primary tool for managing this complexity — AI-powered platforms that aggregate data from across the multimodal supply chain and provide predictive visibility are enabling food companies to manage disruption proactively rather than reactively.
AI in Transportation Management
AI-based platforms provide up-to-date tracking of shipments, analyse supplier performance data, and flag potential problems before they escalate. By compiling data from IoT sensors, GPS, and market intelligence, AI can help predict risks such as supplier delays, port bottlenecks, or geopolitical events. Machine learning models analyse real-time traffic, weather, and delivery constraints to improve shipping routes, reducing delivery delays, transportation costs, and fuel consumption.
The most significant shift in 2026 is the move from reactive to agentic AI — autonomous systems that independently execute rerouting to bypass geopolitical disruptions or climate-related events. Freight forwarders are transitioning into “digital backbones” — companies using AI to predict capacity constraints and automate complex customs documentation, allowing even small food producers to operate like global powerhouses.
Blockchain and FSMA Traceability
FSMA Section 204 requires digital traceability records for specified food categories in the US, mandating key data element capture at each stage of the supply chain. The EU’s Import Control System 2 mandates electronic pre-notification of food shipments into the EU. These regulations are driving adoption of blockchain-based traceability platforms that create immutable end-to-end records of food shipment journeys, enabling rapid targeted recalls and providing the transparency regulators and premium consumers increasingly demand.
8. Sustainability and Decarbonisation
The Shipping Industry’s Carbon Challenge
Transportation is responsible for approximately 10% of global greenhouse gas emissions, with food supply chain logistics representing a disproportionate share of food company Scope 3 emissions. For food manufacturers and retailers with net-zero commitments, the decarbonisation of inbound and outbound logistics is frequently the largest single challenge in their sustainability programmes.
Reefer containers contribute notably to the 140 million tonnes of CO2eq annual emissions released by the container shipping industry, due to harmful refrigerant use and high energy consumption. The sector is growing rapidly, increasing the negative climate impacts considerably in a business-as-usual scenario.
Maersk’s Net-Zero Maritime Leadership
Maersk aims to reach net-zero greenhouse gas emissions across all operations by 2040 — the most ambitious decarbonisation target in the shipping industry. Maersk operates the world’s first ocean-going methanol-enabled container ship and is electrifying inland transport and warehousing while investing in alternative fuels. The company’s MECL1 service returning to Suez Canal transit is part of its broader commitment to maintaining schedule reliability while pursuing net-zero operations.
DHL’s Sustainable Aviation Fuel Leadership
DHL signed one of the largest sustainable aviation fuel agreements in the US — a three-year deal with Phillips 66 to purchase more than 240,000 metric tonnes of SAF — and has been actively testing hydrogen-powered trucks in Europe, North America, and Asia Pacific. For food and beverage customers seeking to reduce Scope 3 air freight emissions, SAF-powered DHL services provide a credible carbon reduction pathway without sacrificing the speed and reliability that air freight serves.
Modal Shift as Decarbonisation Strategy
Rail is 3–4 times more fuel-efficient than trucks, offering an estimated 75% emission benefit for conventional rail over road freight, and both sectors are moving toward electrification. For food and beverage companies with Scope 3 reporting requirements, modal shift from road to rail for long-haul domestic and cross-border movements is the highest-impact, most commercially viable decarbonisation action available — requiring no new technology investment, simply a shift in procurement toward rail-served logistics networks and intermodal solutions.
9. Regional Dynamics
Asia-Pacific: The World’s Food Trade Hub
Asia-Pacific is simultaneously the world’s largest food importing and exporting region — combining China’s extraordinary import demand for protein, dairy, and commodities with Australia’s, New Zealand’s, and Southeast Asia’s export strength in agricultural commodities and seafood. The region’s food trade generates the largest absolute volume of reefer container shipping, bulk vessel movements, and air cargo of any region globally.
China’s domestic food distribution network — encompassing the road freight system that feeds a population of 1.4 billion through a rapidly modernising organised retail and foodservice sector — is itself one of the largest food logistics markets in the world. The China-Europe Railway Express has grown from a niche premium service to a commercially significant corridor handling hundreds of thousands of containers annually.
India is one of the fastest-growing food logistics markets globally, driven by organised retail expansion, quick commerce growth, and a government commitment to reducing logistics costs from 14% of GDP to sub-8% through infrastructure investment and process digitalisation.
North America: The Tariff-Driven Restructuring
North America’s food transportation market is navigating its most significant structural reconfiguration in decades, driven simultaneously by US tariff policy reshaping cross-border trade flows, the nearshoring trend bringing new production capacity closer to US end markets, and the technology-driven transformation of road and rail freight operations.
The US food logistics market is characterised by immense scale — over 6,000 commercial bakeries, hundreds of major food manufacturers, and a retail grocery market approaching USD 800 billion in annual sales, all served by road freight networks that move millions of truckloads of food products weekly.
Europe: Sustainability Leadership and Modal Shift
Europe leads globally in freight sustainability policy, with the EU’s Fit for 55 package creating direct pressure to shift freight from road to rail and waterway. European food logistics operators are deploying IoT and real-time monitoring systems across their road and rail networks, and the modal shift investment in intermodal hub development is beginning to generate measurable shifts in long-haul food freight from truck to rail.
The European food logistics market is facing the additional complexity of post-Brexit UK-EU border controls, which have added documentary and physical inspection requirements to food trade between the UK and the EU that did not exist before 2021 and continue to generate friction costs in food supply chains.
10. Critical Risks and Challenges
Geopolitical Route Disruption
The Red Sea crisis has demonstrated with painful commercial clarity how dependent global food supply chains are on the Suez Canal as a transit corridor. The ceasefire in Gaza has created the conditions for a phased return to Red Sea transit, but the situation remains volatile — the Soufan Center’s 2026 Middle East forecast called Houthi resumption of Red Sea attacks “almost certain” if the Gaza ceasefire collapses. Food and beverage supply chain managers must plan for a binary scenario — Suez open or Suez closed — and maintain contingency plans for either outcome.
Driver Shortages and Road Freight Capacity
The structural shortage of qualified HGV drivers in Europe and North America represents one of the most persistent and intractable challenges in food road freight. An ageing driver workforce, negative industry perception among younger candidates, demanding working conditions, and competition from better-compensated employment in other sectors are creating persistent capacity gaps in road freight that elevate freight rates and reduce scheduling reliability for food shippers.
Fuel Price Volatility
Food transportation costs are disproportionately exposed to fuel price volatility — diesel is the primary energy source for both road freight and the auxiliary power units on reefer trailers. The geopolitical tensions in energy-producing regions, the transition-era energy market complexity created by simultaneous fossil fuel demand and renewable energy investment, and the carbon pricing regimes advancing across European markets all contribute to a fuel cost environment that is more volatile and structurally higher than pre-2020 levels.
Port Congestion and Infrastructure Bottlenecks
Port congestion — when the simultaneous arrival of multiple vessels creates a backlog of containers awaiting unloading — remains a significant and recurring challenge for food importers and exporters dependent on predictable transit times. The potential simultaneous return of Cape-routed and Suez-routed vessels during any transition back to Red Sea transit represents a particularly acute congestion risk that logistics managers are preparing for.
11. Strategic Outlook for Stakeholders
Actionable Recommendations
Lock In Ocean Freight Contracts While the Market Favours Shippers: The structural overcapacity in container shipping — 27% capacity growth against 8.5% cargo growth between 2022 and 2025 — is creating a buyer’s market in ocean freight. Food and beverage companies with significant container volumes should be negotiating multi-year contracts that lock in current favourable rates and service commitments before the market balance shifts, potentially triggered by any significant port congestion event during the Suez Canal return transition.
Build Multi-Modal Flexibility Into Your Supply Chain Network: The Red Sea crisis demonstrated that single-mode dependency creates catastrophic vulnerability when that mode is disrupted. Food supply chain networks that can flexibly route shipments between ocean, air, rail, and road — switching between modes in response to disruption without supply chain breakdown — will sustain competitive advantage in the volatility-normalised environment of 2026 and beyond.
Invest in Digital Traceability Before Regulatory Deadlines Force It: FSMA Section 204, DSCSA, and their global equivalents are mandating digital traceability records for food and pharmaceutical supply chains. Companies investing in blockchain-based, cloud-connected traceability platforms ahead of compliance deadlines are building supply chain transparency capabilities that also deliver commercial value — faster recalls, better inventory management, and the provenance visibility that premium consumers and retailers increasingly require.
Treat Modal Shift as a Commercial and Sustainability Priority: Rail is 3–4 times more fuel-efficient than trucks. For food and beverage companies with Scope 3 reporting requirements, every long-haul tonne-kilometre shifted from road to rail represents both a carbon reduction and a cost saving. Modal shift is the most commercially viable, immediately deployable decarbonisation action available — requiring logistics network redesign and intermodal hub relationships rather than new technology investment.
Strategic Summary: The 2026 F&B Transportation Business Model
| Strategic Priority | Traditional Approach | 2026 Competitive Standard |
|---|---|---|
| Route Strategy | Single primary route | Multi-modal, multi-route network with contingency options |
| Ocean Freight | Spot market dependent | Long-term contracts during buyer’s market windows |
| Technology | TMS and tracking | AI-powered predictive visibility with agentic rerouting |
| Decarbonisation | Annual carbon reporting | Active modal shift, SAF, electric last-mile |
| Regulatory Compliance | FSMA compliance minimum | Blockchain traceability as competitive differentiator |
| Tariff Management | Reactive cost absorption | Proactive nearshoring and supply chain diversification |
12. Leading Industry Companies
| Company | Region | Strategic Focus |
|---|---|---|
| A.P. Moller — Maersk | Denmark/Global | World’s largest container shipping company targeting net zero by 2040. Operating world’s first methanol-enabled container ship. MECL1 service successfully testing Suez Canal return in December 2025. Providing multimodal food logistics solutions including Sea-Air via Oman and Colombo amid Middle East disruption. |
| Mediterranean Shipping Company (MSC) | Switzerland/Global | World’s largest container line by TEU capacity. Dominant reefer container operator for perishable food trade globally. CMA CGM Group’s food-focused reefer container operations are a key competitor. |
| Hapag-Lloyd | Germany/Global | Fifth-largest container line following USD 4.2 billion ZIM Lines acquisition. Gemini Alliance partner with Maersk targeting 90% arrival reliability. |
| CMA CGM | France/Global | Third-largest container shipping company. World Food Programme logistics partner. Comprehensive reefer container service for food and beverage trade. Strong in Asia-Mediterranean food trade corridors. |
| DHL Group | Germany/Global | World’s largest contract logistics provider. Signed one of the largest SAF agreements in the US — 240,000 MT with Phillips 66. Testing hydrogen trucks in Europe, North America, and Asia Pacific. Leading advisor on tariff navigation and nearshoring strategy. |
| DSV | Denmark/Global | Global freight forwarding leader across air, ocean, and road across 90 countries. Green Logistics programme covering CO2 reporting, sustainable warehousing, and alternative fuels. |
| XPO Logistics | USA/Global | Technology-led freight brokerage and LTL trucking. AI-driven route optimisation reducing empty miles. Strong North American food and beverage road freight capability. |
| Kuehne + Nagel | Switzerland/Global | Leading global freight forwarder with strong F&B sector focus. Sustainability strategy encompassing carbon-neutral logistics services. |
| CEVA Logistics (CMA CGM) | France/Global | Comprehensive food and beverage logistics through CMA CGM Group. Strong integration of ocean and land-based logistics for F&B supply chains. |
| DB Schenker | Germany/Global | European rail and road logistics leader. Strong in European food distribution and the China-Europe rail corridor. Decarbonisation investment through rail modal shift. |
Related: As global supply chain volatility persists, the ability to maintain the integrity of perishable goods while optimizing distribution networks has become a critical competitive advantage. Explore the latest advancements in cold-chain technology, digital tracking, and route optimization in our Global Food & Beverage Logistics Industry Report 2026.
Frequently Asked Questions (FAQ)
What is the global food and beverage logistics market size in 2026?
The global food logistics market is valued at approximately USD 187–318 billion in 2026, with estimates varying significantly depending on scope. Fact.MR estimates the food logistics market at USD 318 billion in 2025; Zion Market Research places the market at approximately USD 150 billion in 2024, projected to reach USD 258 billion by 2034; and Maximize Market Research values the market at USD 138 billion in 2024, projected at USD 263 billion by 2032 at a CAGR of 8.3%. When the broader transportation and shipping market serving food and beverage is included — encompassing ocean freight, road freight, rail, air cargo, and cold chain — the total market is considerably larger. The maritime freight transport market alone (within which F&B commands 33% of container volume) is valued at USD 632 billion in 2026. Road freight carries approximately 70% of food logistics volume, while ocean freight handles the largest share of cross-border food trade by tonnage.
What is the Red Sea crisis and how does it affect food and beverage supply chains?
The Red Sea crisis began in late 2023 when Houthi forces in Yemen began attacking commercial vessels transiting the Red Sea and Bab el-Mandeb strait — the critical chokepoint between the Red Sea and the Gulf of Aden that connects Asian and European trade through the Suez Canal. These attacks forced every major container line — Maersk, MSC, Hapag-Lloyd, CMA CGM — to reroute their fleets around the Cape of Good Hope in January 2024, adding approximately 10–14 days to standard Asia-Europe transit times and increasing fuel consumption by approximately 30%. For food and beverage supply chains, the additional transit days are particularly damaging because of shelf-life constraints: fresh produce, chilled dairy, and temperature-sensitive products designed for Suez Canal transit times face quality degradation during the additional days at sea. In February 2026, a cautious, phased return to Suez Canal transit began with the ME11 service, but the full return remains dependent on sustained security in the region and carries its own supply chain risks including potential port congestion as Cape-routed and Suez-routed vessels arrive simultaneously.
What are reefer containers and why are they important for food trade?
Reefer containers — refrigerated intermodal shipping containers — are the critical infrastructure enabling the global trade of temperature-sensitive food products by ocean freight. They are standard 20 or 40-foot ISO containers equipped with an integral refrigeration unit capable of maintaining temperatures from −35°C to +30°C depending on the cargo, powered by electrical connections at ports, on container ships, or at inland facilities. Reefer containers enable global food trade that would otherwise be impossible: Argentine beef shipped to European supermarkets, New Zealand butter delivered to Asian retailers, Ecuadorian bananas reaching North American consumers. The global reefer container fleet is dominated by Maersk, MSC, and CMA CGM. However, conventional reefer containers are a significant emissions source — contributing to the 140 million tonnes of CO2eq annually released by container shipping through harmful refrigerant use and high energy consumption, driving investment in natural refrigerant alternatives with dramatically lower global warming potential.
How are US tariffs affecting food and beverage transportation?
US tariffs — particularly targeting imports from China, with retaliatory tariffs from Canada, Mexico, the EU, and China affecting US food exports — are reshaping global F&B trade flows and logistics networks simultaneously. For food companies importing from China, tariffs of 25% or more on specific ingredient categories (amino acids, food additives, certain agricultural products) are creating direct cost increases. For US food exporters, retaliatory tariffs from trading partners have created new access barriers in markets previously served at preferential rates. The logistics consequence is significant supply chain restructuring: companies are evaluating nearshoring (moving production closer to end markets), alternative sourcing from tariff-exempt geographies, and domestic manufacturing investment to reduce cross-border trade exposure. Cross-border trucking between the US, Canada, and Mexico has seen volume reductions in tariff-affected categories. The strategic response recommended by DHL and other logistics providers is supply chain diversification — reducing single-country sourcing dependency and building multimodal routing flexibility.
What is the China-Europe Railway Express and how does it serve food and beverage?
The China-Europe Railway Express is a network of scheduled rail freight services connecting Chinese manufacturing and export centres (including Chongqing, Chengdu, Xi’an, and Shanghai) with European destinations across Russia, Central Asia, and into Western Europe, with transit times of 18–22 days. This compares favourably to ocean freight transit times of 35–40 days via Suez Canal (pre-crisis) or 50+ days via Cape of Good Hope, while remaining significantly more cost-effective than air freight. For food and beverage, the China-Europe rail corridor is most suited to shelf-stable products, packaged food and beverage, and food ingredients that can tolerate 18–22 day transit times. The corridor gained commercial significance during the Red Sea crisis as an alternative to the extended Cape of Good Hope routing, and is increasingly invested in by European retailers and food manufacturers as a diversification option for Asian-sourced food products.
How is the shipping industry decarbonising food and beverage logistics?
The shipping and transportation industry is pursuing decarbonisation through multiple parallel strategies. In ocean freight, Maersk is leading with its net-zero 2040 target, operating the world’s first methanol-enabled container ship and investing in alternative fuels including green methanol, green ammonia, and sustainable shipping fuels. In air freight, DHL has signed one of the largest SAF (Sustainable Aviation Fuel) agreements in the US — 240,000 metric tonnes with Phillips 66 — while testing hydrogen-powered trucks across three continents. In road freight, the transition to battery-electric heavy goods vehicles is advancing for urban and suburban food distribution, while hydrogen fuel cell trucks are emerging for long-haul routes. In freight modal shift, rail’s 3–4× fuel efficiency advantage over road — delivering an estimated 75% emission reduction — is the most commercially available and immediately deployable decarbonisation option for long-haul food distribution. The EU’s Fit for 55 package is creating regulatory incentives for freight modal shift from road to rail, and food companies with Scope 3 reporting requirements are increasingly using modal shift as their primary logistics decarbonisation strategy.
Who are the leading food and beverage transportation and shipping companies in 2026?
The global food and beverage transportation and shipping market is served by a combination of large diversified logistics groups and specialist carriers. In ocean freight, Maersk, MSC, Hapag-Lloyd (following ZIM acquisition), CMA CGM, and COSCO are the dominant carriers, with Maersk leading in both reefer container capacity and decarbonisation ambition. In contract logistics and freight forwarding, DHL Group is the world’s largest provider, followed by DSV, Kuehne + Nagel, and DB Schenker. In North American road freight, XPO Logistics, J.B. Hunt, and C.H. Robinson are the dominant food freight providers. In pharmaceutical and food cold chain logistics, Lineage Logistics and Americold lead in temperature-controlled warehousing, while NewCold leads in automated cold chain. The cold chain logistics companies covered in detail in the ESSFeed Cold Chain Report — Lineage, Americold, DHL, Maersk, NewCold — collectively serve the majority of the global food cold chain logistics market.
Sources and Additional References
- Mordor Intelligence: Maritime Freight Transport Market Size & 2031 Share — https://www.mordorintelligence.com/industry-reports/global-maritime-freight-transport-market
- Zion Market Research: Food Logistics Market Size, Share, Trends, Growth & Forecast 2034 — https://www.zionmarketresearch.com/report/food-logistics-market
- PRNewswire / Maximize Market Research: Food Logistics Market to Hit USD 262.93 Billion by 2032 — https://www.prnewswire.com/news-releases/food-logistics-market-to-hit-usd-262-93-billion-by-2032–led-by-cold-chain-and-online-grocery-logistics-growth-says-maximize-market-research-302688712.html
- Fact.MR: Food Logistics Market Global Analysis Report 2026–2036 — https://www.factmr.com/report/food-logistics-market
- Global Market Statistics: Food and Beverage Cold Chain Logistics Market Size — https://www.globalmarketstatistics.com/market-reports/food-and-beverage-cold-chain-logistics-market-13757
- ESSFeed: Global Supply Chain 2026 — Navigating F&B Shipping & Logistics — https://essfeed.com/global-supply-chain-2026-fb-logistics/
- ING Think: A Red Sea Return Would Be a Game Changer for Container Shipping in 2026 — https://think.ing.com/articles/returning-to-the-red-sea-a-key-event-to-watch-in-container-shipping-for-2026/
- Maersk: Global Market Update — Winter 2026 — https://www.maersk.com/news/articles/2026/01/08/maersk-global-market-update-winter
- Maersk: Europe Market Update — April 2026 — https://www.maersk.com/news/articles/2026/04/01/europe-market-update-april
- Xeneta: Red Sea Return — What It Means for 2026 Container Shipping Contract Rates — https://www.xeneta.com/blog/red-sea-return-what-it-means-for-2026-container-shipping-contract-rates
- Container News: The Return of Container Shipping to the Red Sea — What Supply Chain Leaders Must Know in 2026 — https://container-news.com/the-return-of-container-shipping-to-the-red-sea-what-supply-chain-leaders-must-know-in-2026/
- Fresh Fruit Portal: Global Shipping Braces for Rough 2026 as Overcapacity Crisis Sets to Hit — https://www.freshfruitportal.com/news/2026/01/07/global-shipping-outlook/
- Zencargo: Red Sea Reopening — Understanding the Impact on Your Supply Chain — https://www.zencargo.com/resources/red-sea-reopening-2026/
- Suaid Global: Red Sea Shipping Crisis 2026 — Rates, Reroute, Transit — https://suaidglobal.com/insights/red-sea-shipping-crisis-2026/
- World Atlas: How the Red Sea Shipping Crisis Affects Global Trade — https://www.worldatlas.com/economics/how-the-red-sea-shipping-crisis-affects-global-trade.html
- Scan Global Logistics: 2026 Kicks Off with a Carrier and Tariff Big Bang — https://www.scangl.com/news/2026-kicks-off-with-a-carrier-and-tariff-big-bang/
- DHL Logistics of Things: Ocean and Air Freight on Diverging Paths in 2026 — https://lot.dhl.com/ocean-air-freight-diverging-paths-2026/
- DHL: Who Pays Import Tariffs and How US Tariffs Affect You in 2026 — https://www.dhl.com/discover/en-global/logistics-advice/logistics-insights/who-pays-the-tariffs-on-imports
- DHL: Everything US Businesses Need to Know About Trade, Tariffs, Nearshoring and Supply Chains in 2026 — https://www.dhl.com/discover/en-us/news-and-insights/reports-and-press-releases/trade-tariffs-nearshoring-supply-chains-2026
- Service Truck Magazine: Nearshoring, Tariffs, and Geopolitical Shocks Reshape North America’s Trucking Outlook for 2026 — https://www.servicetruckmagazine.com/news/a-global-economy-in-transition/
- Chartersync: 7 Essential Cargo Transportation Methods to Know in 2026 — https://www.chartersync.com/blog/cargo-transportation
- EDF+Business: Riding the Rails — Can Intermodal Transport Help Decarbonize Freight? — https://business.edf.org/insights/riding-the-rails-can-intermodal-transport-help-decarbonize-freight/
- ICCT: Beyond Trucks — Toward a Greener Global Freight Transportation System — https://theicct.org/toward-a-greener-global-freight-transportation-system-oct25/
- International Climate Initiative: Greener Reefers in International Maritime Transport — https://www.international-climate-initiative.com/en/project/greener-reefers-in-international-maritime-transport-23-i-483-global-g-greener-reefers/
- Micromarket Insights: Food Grade Liquid Bulk Transportation Market 2026–2033 — https://www.micromarketinsights.com/product/food-grade-liquid-bulk-transportation-market/