
Introduction
The Global Crops And Grains Market 2026 is defined by a distinct transition from the loose, high-inventory dynamics of the 2024–2025 marketing years toward a much tighter supply-demand balance. As structural shifts in domestic biofuel consumption accelerate and adverse weather events limit yields in critical agricultural corridors, the pricing and logistics of staple grains are facing renewed pressure. This report provides a comprehensive, data-driven overview of production trajectories, trade dynamics, leading corporate entities, and systemic vulnerabilities shaping the global crops and grains market in 2026.
Table of Contents
Executive Summary
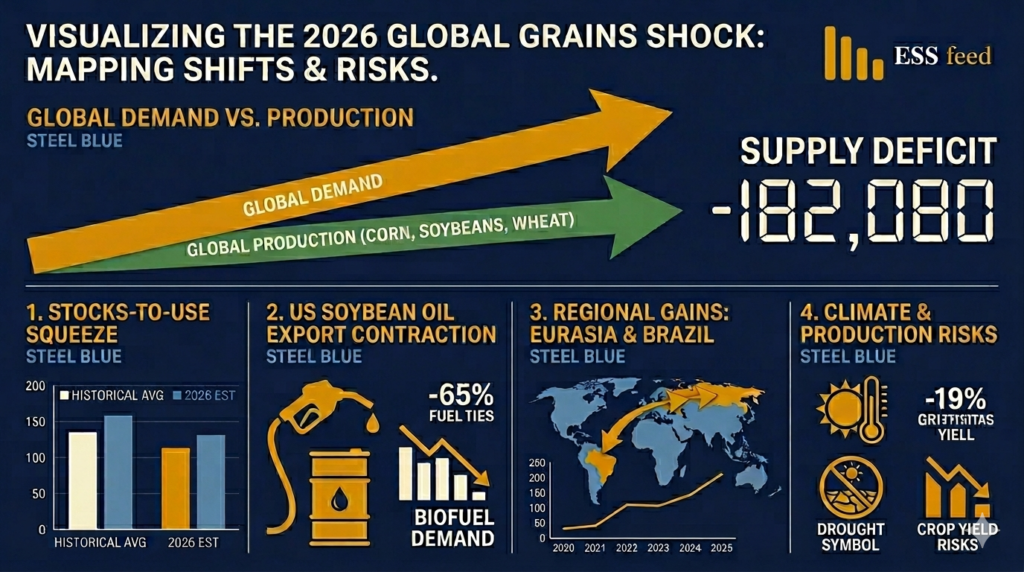
The Global Crops And Grains Market 2026 is characterized by a structural normalization in inventory levels. According to recent World Agricultural Supply and Demand Estimates (WASDE) data released by the United States Department of Agriculture (USDA), global stock-to-use ratios across major field crops are falling sharply compared to the previous marketing year: corn ratios are dropping from 13.0% to 12.1%, soybeans from 8.0% to 6.9%, and wheat from 46.1% to 40.7% (Plan, 2026).
While total volumes for corn remain robust, driven by extensive planting in the Western Hemisphere, a significant contraction in the global wheat supply has triggered strong bullish trends in futures markets. Concurrently, geopolitical friction in the Middle East has introduced an array of supply-side operational risks. A sharp month-on-month escalation in urea fertilizer costs—surging approximately 46% by late Q1 2026—coupled with recurring disruptions along critical maritime channels like the Strait of Hormuz, has directly amplified total overhead costs for production and transport worldwide (OUTLOOK, 2026).
Key Takeaways
- Tighter Stock-to-Use Ratios: Inventories relative to consumption are declining globally across corn, wheat, and soybeans, indicating a transition toward a tighter, more volatile supply floor (Plan, 2026).
- Wheat Supply Crunch: Global wheat production has contracted significantly, led by a 21.3% drop in U.S. production due to localized drought conditions, shifting competitive export advantages to Eurasia (Plan, 2026).
- Biofuel Demand Reshaping Trade: Rising domestic soybean crushing in the U.S. to satisfy biomass-based diesel mandates has effectively decimated outward U.S. soybean oil exports, lowering them to near-zero historic lows (Janzen, 2026).
- Escalating Input Costs: Geopolitical conflicts have driven significant upward spikes in fertilizer and fuel costs, exposing heavily import-dependent agricultural producers, such as Brazil, to severe margin compression (OUTLOOK, 2026).
- Logistical Resilience: Black Sea grain corridors exhibit notable structural persistence. Despite ongoing military-related operational risks, scenario modeling indicates Ukraine maintains the capacity to service over 5% of global grain exports (Zavadska, 2026).
The Global Crops And Grains Market 2026 Dynamics: Supply, Demand & Trade Flows
The following table provides a comparative summary of The Global Crops And Grains Market 2026 export landscape, primary trade flows, and production trends across the three primary global grain and oilseed pillars for the 2026 marketing period.
Global Grain & Oilseed Trade Profile (2026)
| Commodity | Leading Exporters (By Volume) | Dominant Importing Nations | Core Structural Driver in 2026 |
| Corn | United States, Brazil, Argentina, Ukraine, Russia, South Africa | China, Japan, Mexico, European Union, South Korea | High U.S. production yields (~183 bushels/acre) supporting the second-highest U.S. export volume on record (Plan, 2026). |
| Soybeans | Brazil, United States, Paraguay, Argentina | China, European Union, Egypt, Indonesia | Brazil widens its export dominance over the U.S. due to dedicated Chinese import commitments and lower U.S. export allocations (Plan, 2026). |
| Wheat | Russia, European Union, Canada, Australia, United States, Argentina, Ukraine | Egypt, Indonesia, Turkey, Algeria, Philippines | Severe supply contractions in the Americas due to weather disruptions, elevating Eurasian export market share (Plan, 2026). |
Deep-Dive Market Analysis For The Global Crops And Grains Market 2026
1. Production and Export Leaders
The production of global staples is highly concentrated, leaving supply chains vulnerable to regional weather patterns and shifting trade alignments.
Corn
The United States continues to hold a dominant position in the global corn trade. U.S. corn production for the current marketing period is forecast at 15.9 billion bushels, supported by strong national average yields of roughly 183 bushels per acre (Plan, 2026). This has positioned the U.S. to project exports of 3.15 billion bushels—the second-highest export volume recorded in its history (Plan, 2026). Brazil and Argentina remain the leading competitors in the Southern Hemisphere, though their production costs are tracking higher due to escalating fuel and shipping freight dynamics (OUTLOOK, 2026).
Soybeans
A fundamental shift is occurring within the global oilseed trade. Brazil has firmly entrenched its lead over the United States, exporting more than double the volume of the U.S. (117.5 million bushels from Brazil compared to 44.36 million bushels from the U.S.) (Plan, 2026). This widening gap is driven by long-term structural factors, notably China’s persistent procurement pivot toward Brazilian origination (Plan, 2026).
Furthermore, U.S. export capabilities have been intentionally throttled by domestic demand. The expansion of domestic processing facilities has caused U.S. soybean crushing volumes to jump 12% over a two-year period, redirecting raw beans inward to generate soybean oil for biomass-based diesel production (Janzen, 2026). Consequently, U.S. soybean oil exports have collapsed to a bare minimum projection of just 400 million pounds (Janzen, 2026).
Wheat
The wheat sector represents the most volatile and fiercely contested segment of the 2026 market. Severe environmental challenges, particularly acute drought conditions across key North American growing regions, have caused new-crop U.S. wheat production to contract by 21.3% relative to last year (Plan, 2026).
With total U.S. supply shrinking to 2.64 billion bushels, the global balance of power has shifted heavily toward Eurasia. Favorable growing seasons across Russia, the European Union, and Ukraine have allowed these regions to capture a larger share of the international market, offsetting lower output from traditional exporters like Canada and Australia (Plan, 2026).
[Global Trade Flow Realignment]
   U.S. Weather Disruptions (Wheat -21.3%) ----> Shift to Eurasian Supply (Russia, EU)
   U.S. Biofuel Mandates (Soybean Crush +12%) --> Shrinking U.S. Exports -> Brazil Dominance
2. Major Importing Nations and Food Security
The high concentration of grain exporters creates systemic vulnerabilities for net food-importing regions (Aboushady, 2026). In North Africa and parts of sub-Saharan Africa, nations like Egypt remain highly exposed to changes in trade agreements and sudden logistics shocks (Aboushady, 2026).
While trade openness can improve short-term food affordability, it increases structural dependence on global markets (Aboushady, 2026). In contrast, East Asian nations have taken diverse steps to manage these risks. Indonesia has utilized strong domestic production and targeted import restrictions to stabilize food supplies, whereas the Philippines has introduced fuel subsidies and streamlined procurement rules to shield consumers from broader international price volatility (OUTLOOK, 2026).
3. Leading Agribusiness Enterprises
The processing, physical trading, and logistical execution of these global flows remain concentrated among major multi-national agribusiness enterprises. The traditional ABCD cohort of commodity traders—comprising ADM (Archer-Daniels-Midland), Bunge, Cargill, and Louis Dreyfus—alongside state-backed entities like China’s COFCO, manage the bulk of transnational cross-border grain volumes. In The Global Crops And Grains Market 2026, corporate strategies are heavily focused on expanding processing capacities within producing nations (such as ADM and Bunge expanding crushing plants in the U.S. Midwest) to profit from local green energy and renewable diesel incentives rather than relying solely on traditional raw bulk export shipping margins.
Valued at USD 559.66 billion in 2026, the global animal feed industry is rapidly shifting toward precision nutrition and digital intelligence. For a deep dive into the current market dynamics, supply chain challenges, and growth drivers, read the full Global Animal Feed Industry Report 2026.
Methodology
The Global Crops And Grains Market 2026 findings presented in this report are synthesized from current public agricultural data, statistical models, and scenario matrices available as of mid-2026. Quantitative production metrics, yield figures, and stock-to-use ratios were extracted directly from the May 2026 World Agricultural Supply and Demand Estimates (WASDE) publications compiled by the United States Department of Agriculture (USDA) (Plan, 2026). Long-term forecasting trends and international policy impacts were evaluated against agricultural outlooks from the Food and Agriculture Organization (FAO) and the Organisation for Economic Co-operation and Development (OECD) (Zavadska, 2026). Regional inflation figures, fertilizer indices, and maritime transport data were obtained from the March 2026 Global Markets Outlook and the Agricultural Market Information System (AMIS) Market Monitor published by the World Bank (OUTLOOK, 2026). Factual and statistical baselines for specific country risk models were evaluated using peer-reviewed autoregressive integrated moving average (ARIMA) data projections (Zavadska, 2026).
Sources & References
Sources with URLs
- The World Bank: Food and Nutrition Security Update (March 2026)
- University of Illinois (farmdoc daily): New-Crop Soybean Oil Export Projections & Volatility Analysis
- Ohio State University (Ohio Ag Manager): May 2026 WASDE Report Outlook and Commodity Analysis
- Frontiers in Sustainable Food Systems: Scenario Modeling of Grain Production Potential: The Case of Ukraine
- CGSpace / International Food Policy Research Institute: Africa in Global Agricultural Trade and Food Security Trends
References
Aboushady, N. (2024). Africa in global agricultural trade and food security: Recent trends. CGSpace Regional Trade Policy Review, 12–28.
Janzen, J. (2026). New-crop soybean oil export projection suggests greater price volatility. farmdoc daily, 16(74), 1–4.
OUTLOOK, G. M. (2026). Food and nutrition security update: Issue 121. The World Bank Global Commodity Markets Group, 1–9.
Cited by: 21
Plan, W. Y. B. M. (2026). May 2026 WASDE report outlook: Overview of the global commodity market. Ohio Ag Manager – Ohio State University Extension, 4(5), 12–15.
Zavadska, Y. (2026). Scenario modeling of grain production potential in conditions of military risk: The case of Ukraine. Frontiers in Sustainable Food Systems, 10(1737907), 1–11.
Cited by: 1
FAQ Section
Why are global grain stock-to-use ratios dropping in 2026?
The drop in stock-to-use ratios indicates that global consumption is outpacing production, drawing down reserves. This shift toward tighter inventories is driven by a combination of weather-related yield challenges—most notably a significant contraction in the North American wheat harvest—and expanding domestic demand for oilseeds within major exporting nations (Plan, 2026).
What is causing the near-zero export projection for U.S. soybean oil?
The near-zero export projection is caused by domestic policy mandates. U.S. soy processors are crushing historically high volumes of soybeans to extract oil for biomass-based diesel production to meet renewable fuel standard blending obligations (Janzen, 2026). This domestic demand consumes almost all available local oil, leaving negligible volumes for the international export market (Janzen, 2026).
How are rising fertilizer prices impacting agricultural production?
Fertilizer prices, particularly for nitrogen-based products like urea, spiked by roughly 46% early in 2026 due to conflicts in the Middle East and disruptions to major trade routes like the Strait of Hormuz (OUTLOOK, 2026). These disruptions raise the cost of agricultural inputs, squeezing profit margins for farmers and increasing food production costs, especially in regions like Brazil that rely on imports for 80% to 90% of their fertilizer needs (OUTLOOK, 2026).
Is Ukraine still able to export grains despite geopolitical and military risks?
Yes. Despite ongoing infrastructure challenges and logistical constraints along Black Sea shipping channels, economic modeling indicates that Ukraine’s agricultural sector remains resilient (Zavadska, 2026). Through technological modernization and alternative logistics corridors, Ukraine is projected to sustain a meaningful presence, supplying over 5% of global grain exports even under elevated risk scenarios (Zavadska, 2026).