

As of June 2026, global agricultural markets are navigating a shift from the tight supply concerns that dominated the early months of the year toward a period of price correction. While global cereal production is forecast to tighten slightly for the 2026/27 cycle, market sentiment has turned bearish in recent weeks due to favorable weather forecasts in the United States and strong harvest progress in South America.
Key takeaways as of early June 2026:
- Price Correction: Significant liquidation by investment funds has pushed corn, soybean, and wheat futures to multi-month lows, overriding earlier supply-side inflation fears.
- Production Outlook: Global 2026/27 cereal production is projected at ~2,982 Mt. While down from record highs, it remains robust. U.S. winter wheat production is notably down 25% YoY, but global stockpiles remain sufficient.
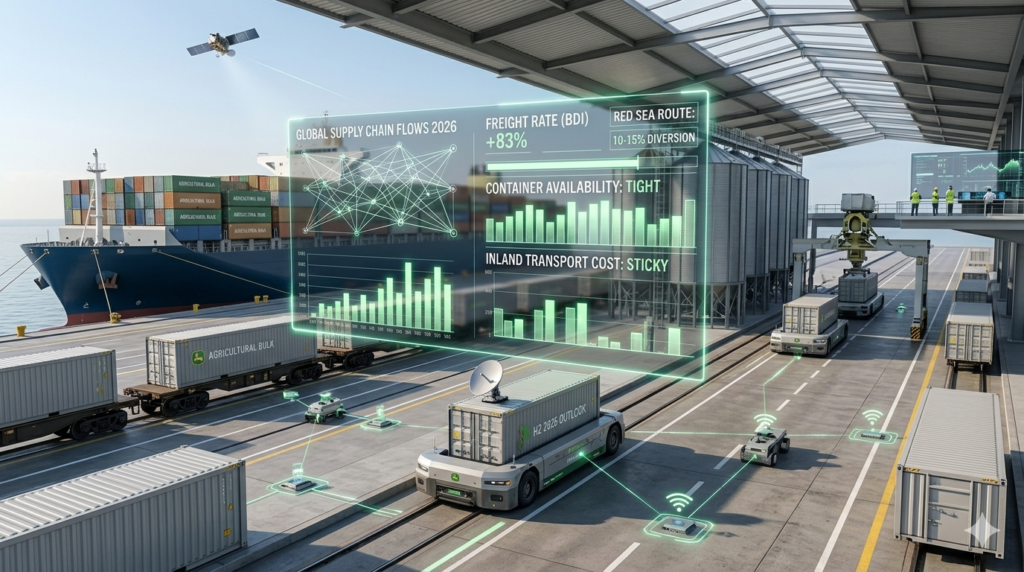
- Logistics: The global shipping market is entering a “buyer’s market” on Trans-Pacific routes due to an oversupply of vessel capacity and softer retail demand, though Europe-bound lanes remain tighter due to Red Sea diversions.
- Inflation: Consumer food inflation remains sticky but is trending downward in developed economies, now driven more by energy and processing costs than by raw commodity prices.
Global Crops: Detailed Supply, Stocks, and Price Dynamics
As of June 2026, the agricultural landscape is characterized by a “transition phase”—moving from the supply-stressed environment of late 2025 into a period where markets are heavily discounting future weather risks in favor of current, ample harvest supplies in key regions.
Cereals: The Wheat/Maize Divergence
- Wheat: The 2026/27 outlook is defined by a significant geographic decoupling. While global production is projected to dip to 819 Mt (a 3% decline from the previous year’s records), the market is not facing a structural deficit.
- Exporters vs. Importers: Major exporters (U.S., Argentina, Australia) are seeing output pullbacks. Specifically, U.S. winter wheat has been crippled by severe drought in the “Wheat Belt” (Kansas, Oklahoma, Texas), leading to some of the lowest yield projections of the century. Conversely, traditional importers in North Africa and the Near East are benefiting from record or near-record local harvests, which is dampening global import demand and creating intense competition among suppliers to capture remaining market share.
- Maize (Corn): Global markets are currently in a “bearish” state. Despite an expected production dip to 1,295 Mt, the massive, record-breaking harvest from South America (particularly Argentina) has saturated the supply pipeline.
- Technical Sentiment: Because the supply chain is currently well-stocked, traders have shifted focus toward technical selling. Futures contracts (like the CBOT Dec ’26) are being pressured by high inventory levels in Europe and a cooling of feed-demand urgency in emerging markets.
Rice: The Indian Dominance
- Market Power: India’s influence over the global rice market remains absolute, as it commands ~40% of global trade. The market is currently “waiting game” territory; global prices are suppressed by a surplus of supplies in major exporting nations (India, Thailand, Vietnam).
- Logistics & Policy: Beyond crop availability, price volatility is now more heavily tied to geopolitical logistics than harvest yields. With trade routes in the Middle East and the Gulf facing disruption, exporters have been forced to prioritize “Free on Board” (FOB) terms and re-route shipments to West Africa to maintain export momentum. This shift acts as a hidden tax on the market, as buyers must now absorb higher freight costs, making Indian rice marginally less competitive than it would be under standard conditions.
Oilseeds & Sugar: Biofuel and Climate Factors
- Soybeans: The market is optimistic about a U.S. recovery. USDA projections for a 4.4-billion-bushel crop are driving expectations of record-high “crush” volumes. The industry is currently betting on an aggressive expansion in domestic biomass-based diesel production, which is absorbing the increased supply and keeping the focus on crush margins rather than just raw export demand.
- Sugar: The market is currently grappling with a “Brazil-centric” supply model.
- The Ethanol Factor: In Brazil, the world’s largest producer, higher domestic blending mandates (E30) and the relative profitability of ethanol compared to sugar mean that a larger portion of the sugarcane crop is being diverted away from the sugar mill.
- Climate Risks: While the current market is reacting to this diversion, the “hidden” risk is the looming El Niño. Any significant weather impact in India or Thailand during the second half of 2026 could quickly turn this “balanced” market into a deficit scenario, as global buffer stocks remain tight.
Summary Table: Key Commodity Drivers (June 2026)
| Commodity | Primary Price Driver | Market Sentiment |
| Wheat | U.S./Argentina crop failures vs. North African self-sufficiency | Neutral/Cautious |
| Maize | South American surplus and reduced feed demand | Bearish |
| Rice | India’s export logistics and shipping re-routing | Weak/Suppressed |
| Soybeans | U.S. record-crush expansion for biofuels | Moderately Bearish |
| Sugar | Brazil ethanol mandates vs. looming El Niño risk | Volatile |
Logistics, Inflation & Macro-Drivers: Detailed Analysis (June 2026)
The current global logistics environment has shifted dramatically in the last 30 days. While earlier months suggested a potential cooling in shipping costs, June 2026 has witnessed a sharp “early peak season” surge, complicating the outlook for commodity-driven inflation.
1. The Logistics Paradigm: From “Crunch” to “Early Peak”
The maritime shipping landscape is currently experiencing a profound tightening of vessel capacity. Contrary to expectations of a gradual softening, major trade indices (such as the Drewry World Container Index) have seen double-digit percentage surges in the first week of June.
- The “Early Peak” Phenomenon: Logistics providers are reporting that the traditional “peak season” (typically Q3) has arrived in late Q2. This is driven by aggressive front-loading of cargo. Importers, particularly in the U.S., are rushing to secure inventory ahead of anticipated July tariff escalations and as a hedge against potential energy-related shipping disruptions.
- The Red Sea/Hormuz Factor: The persistent instability in the Red Sea and near the Strait of Hormuz remains the primary bottleneck. Because vessels are forced to take the longer route around the Cape of Good Hope, the effective supply of global container capacity has been reduced by roughly 10–15%. This “capacity absorption” means that even without a massive surge in total global demand, the available space for commodities is constrained, driving spot rates to multi-year highs.
- Inland Resilience and Costs: While ocean freight is volatile, inland transport (trucking and rail) is entering a phase of “firming.” Carriers are regaining pricing leverage as labor shortages persist and diesel fuel costs remain sensitive to Middle Eastern oil price volatility. For shippers, this means that even if ocean spot rates eventually correct, the “last mile” and domestic distribution costs will likely remain sticky due to high operating expenses (Opex) for trucking fleets.
2. Inflationary Pressures: The Lagging Pass-Through
As of May 2026, the FAO Food Price Index (FFPI) is hovering at 130.8 points. While this is 2.9% higher than a year ago, it is critically important to distinguish between commodity prices (the raw inputs) and Consumer Price Index (CPI) (the retail price).
- The Mechanism of Lag: Historically, there is a 6–12 month “transmission lag” between a spike in a global commodity index and the reflection of that price in your local grocery store. The “softening” of inflation currently observed in many developed markets is the result of lower commodity prices from late 2025 filtering through the system.
- The “Stickiness” of Retail Prices: The current rise in raw cereal and sugar prices (seen in the May 2026 FAO data) will not hit the consumer immediately. Instead, we are seeing a “stair-step” effect:
- Phase 1 (Immediate): Raw material price volatility hits commodity traders and large-scale buyers.
- Phase 2 (3–6 Months): Manufacturers adjust wholesale prices to compensate for rising input costs (energy, fertilizer, and freight).
- Phase 3 (6–12 Months): The final consumer pays the premium at retail.
- Current Outlook: Because shipping and energy costs have spiked in June 2026, we are effectively “seeding” a new inflationary cycle for late 2026/early 2027. Even if raw crop prices stabilize due to good harvests, the “logistics tax”—higher costs for shipping, insurance, and fuel—will likely prevent food inflation from dropping significantly below the 2–3% range in most advanced economies.
Summary Table: Logistics & Inflation Drivers (June 2026)
| Driver | Trend | Impact on Food Inflation |
| Ocean Freight (Trans-Pacific) | Surging (Early Peak Season) | Upward pressure on imported food inputs |
| Inland Trucking | Firming (Supply-side tightness) | Increased retail delivery costs |
| Energy/Fuel | Volatile (Geopolitical risk) | Sustained pressure on fertilizer/processing costs |
| Raw Commodity Inputs | Recent stabilization/slight rise | Will impact retail prices in Q4 2026/Q1 2027 |
H2 2026 Forecast Scenarios: The Convergence of Supply and Logistics
As we navigate the second half of 2026, the global agricultural sector is no longer just a story of harvest yields and climate patterns. It is increasingly a story of “landed cost volatility.” The integration of structural logistical constraints into your planning is now as critical as monitoring rainfall or fertilizer prices.
Below is the updated forecast incorporating the “Logistics Tax”—the persistent premium on shipping and transport that is reshaping global food markets.
1. Baseline Scenario (50% Probability)
- The Driver: A mild-to-moderate El Niño occurs, causing localized yield variability. Simultaneously, the global shipping industry settles into a “new equilibrium,” where the Cape of Good Hope rerouting remains the norm, keeping freight costs structurally elevated but predictable.
- Logistical Impact: Shipping costs stabilize at current mid-year “higher-for-longer” levels. Carriers continue to use “blank sailings” (canceling scheduled trips) to match capacity with sluggish demand, preventing any dramatic price collapse in ocean freight.
- Market Impact: Food inflation enters a period of moderate “stair-step” cooling. The cost of raw commodities remains stable, and while the “logistics tax” prevents a return to pre-2022 price levels, it does not trigger new inflationary spikes.
2. Upside Shock Scenario (25% Probability)
- The Driver: An “Extreme El Niño” event hits, combined with a sharp intensification of geopolitical instability in the Middle East.
- Logistical Impact: A “double-hit” occurs. First, energy price spikes drive bunker fuel costs higher. Second, heightened maritime security threats force further diversions or lead to insurance surcharges so high that specific long-haul routes for non-essential agricultural goods become commercially unviable.
- Market Impact: Grain futures rally 10–20% on the back of production failures. This is compounded by a “logistics bottleneck” where exporters in Southern Hemisphere nations (Brazil, Australia) struggle to secure refrigerated containers and vessel space, causing massive regional price disparities and triggering protectionist export bans.
3. Downside Relief Scenario (25% Probability)
- The Driver: Near-ideal growing weather leads to record-breaking yields, while global consumer demand softens significantly due to slowing economic growth, leading to an oversupply of vessel capacity.
- Logistical Impact: Faced with massive overcapacity and a lack of cargo, shipping lines abandon “blank sailings” and resume aggressive competition for volume. Freight rates begin a sharp decline, significantly lowering the “landed cost” of food staples.
- Market Impact: A “forced liquidation” occurs. Abundant supply combined with rapidly falling freight costs leads to a 5–10% price correction. Retail food inflation in emerging markets collapses toward zero, providing the first real economic relief since the 2025 energy shocks.
Key Indicators to Monitor: Updated for Logistics
To navigate these scenarios, stakeholders must treat logistics indicators as early-warning systems for broader market shifts:
| Indicator | Why It Matters for Agriculture |
| Drewry/FBX Index | Tracks real-time ocean freight costs; a sudden spike signals a “front-loading” rush that will soon inflate your landed food costs. |
| Bunker Fuel/Oil Prices | Direct proxy for transport inflation; if Brent crude spikes, inland and ocean freight costs will follow within 30–60 days. |
| USDA WASDE (Stocks-to-Use) | The gold standard for supply; falling ratios make the market “logistically sensitive,” meaning any minor shipping delay will trigger outsized price reactions. |
| Cape of Good Hope “Transit Times” | Every additional 10–14 days of transit adds “hidden” costs—financing, insurance, and risk of spoilage. Monitor if these times lengthen due to port congestion at the Cape. |
| Ammonia/Natural Gas | The ultimate input cost indicator. High energy prices = high fertilizer costs = reduced yields in 2027. |
Conclusion: Strategic Outlook for H2 2026
As of June 2026, the global agricultural sector is operating in a high-complexity environment where traditional supply-demand fundamentals are increasingly dictated by geopolitical and logistical externalities. While the immediate outlook suggests a period of price moderation driven by healthy South American harvests and robust global stocks, stakeholders should not equate this “bearish” sentiment with long-term stability.
The “logistics tax”—manifesting through persistent Red Sea rerouting, higher bunker fuel costs, and early-season container capacity constraints—remains the primary structural headwind for the remainder of the year. This factor effectively floors the potential for significant food price deflation, regardless of how favorable weather patterns or crop yields may be.
Strategic Recommendations:
- Prioritize Resilience over Just-in-Time: Given the heightened sensitivity of the supply chain to “logistics shocks,” businesses should maintain slightly elevated buffer stocks for critical commodities.
- Monitor the “Early Peak” Indicators: Pay close attention to freight indices and transit times. A worsening of the current “early peak season” will serve as a leading indicator of renewed upward pressure on retail food prices in Q4 2026.
- Focus on Input-Cost Hedge Management: With natural gas and nitrogen-based fertilizer prices linked closely to regional energy stability, agricultural entities must continue to hedge against energy volatility to protect margins for the 2027 growing season.
Ultimately, the H2 2026 market will be defined by the interplay between the cooling effect of adequate supply and the heating effect of the “logistics tax.” By closely tracking the leading indicators outlined in this report—particularly USDA stocks-to-use ratios, ENSO intensity, and global shipping indices—stakeholders will be best positioned to navigate the volatility ahead and adapt to the evolving agricultural landscape.
