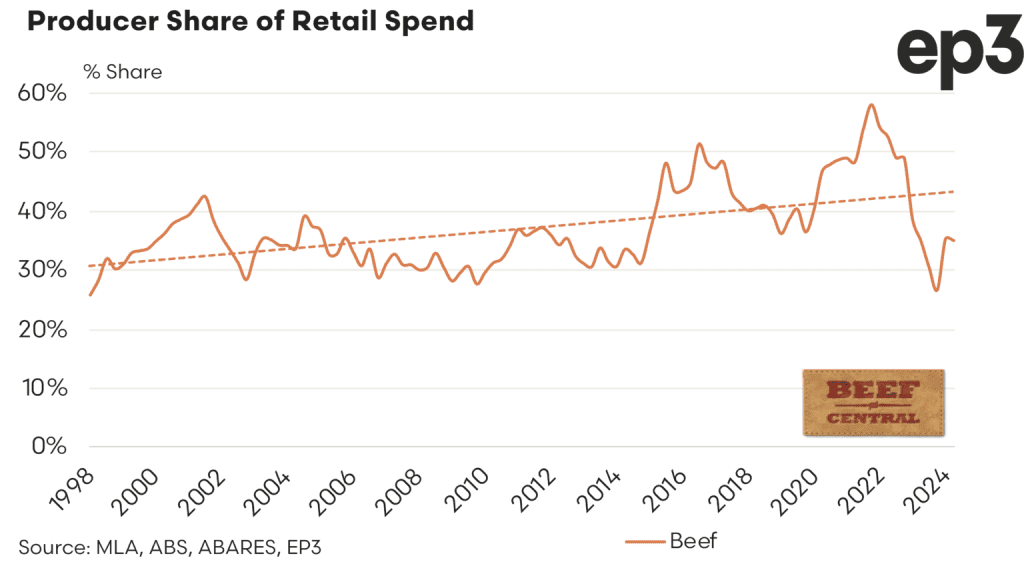
THE Australian beef producer’s share of retail dollar spend on beef has tracked sideways, after hitting all-time historical lows back in the December quarter.
The recent release of June 2024 quarterly Consumer Price Index data from the Australian Bureau of Statistics provides the opportunity to update the quarterly producer share of retail dollar calculation (see details below) published jointly by Episode3 and Beef Central.
As can be seen on the graph above, the recent recovery in saleyard cattle prices during the second quarter has helped maintain retail beef market share for producers, currently sitting at 35 percent for the second quarter, down marginally from 35.2pc in the March quarter, due to sideways movements for both saleyard and retail beef prices.
March was the best result seen for producer share since the second quarter of 2023, but a long way off the long-term trend line growth seen since the late 1990s.
Back in December the beef producer share of retail $ dropped to its lowest point since the data-set began back in 1998, at just 25.8pc. Back in 2022-23 when cattle prices approached record levels, the producer share index soared to almost 60pc.
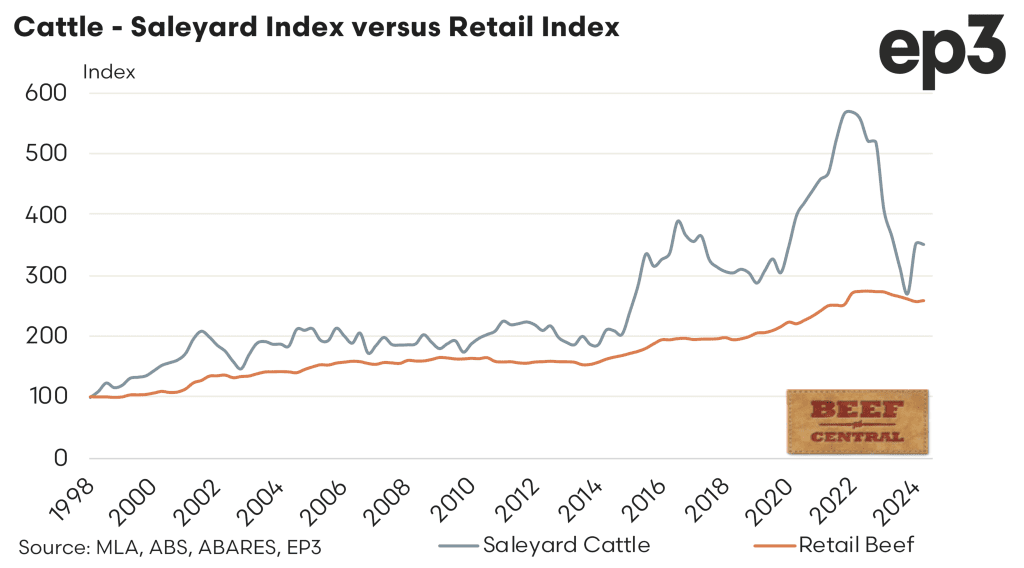
In the graph above comparing the saleyards cattle price index versus the retail price index (1998 providing the benchmark at 100 for both), the saleyard index was little changed in the June quarter, having lifted 30pc between December and March from 271 to 352. Retail beef prices mirrored the sideways movement seen at the saleyard with the index increasing by just 1 point over the June quarter from 258 to 259.
Background to the producer share of retail prices calculation
In collaboration with analyst Matt Dalgleish from Episode 3, Beef Central last year launched a new quarterly series looking at trends in the beef producer’s typical share of the retail consumer’s spend on beef products.
A similar analysis was compiled by MLA for four years, before being discontinued by the industry service delivery company back in December 2016. The project was originally launched as a result of producer requests during the 2012 MLA annual general meeting.
Beef Central sought, and gained MLA’s blessing to resurrect the discontinued series, based on clear reader interest. The same formula is used to compile the new set of results as originally used by MLA (see explanation of the calculation below).
Episode 3 and Beef Central now jointly publish a quarterly report, soon after ABS quarterly retail beef price data is released.
The exercise sees national saleyard cattle prices in carcase weight terms being converted into an estimated retail weight equivalent and compared to average retail beef prices, as reported by ABS .
About the producer share of retail spend calculation
The beef producer share of the retail dollar is calculated using a range of assumptions:
- The national saleyard trade steer indicator is used as the benchmark livestock prices, representing animals suited for the domestic market. Livestock prices are collected by MLA’s NLRS.
- Converting the carcase weight price to an estimated retail weight equivalent price is achieved using a retail meat yield for beef of 68.7pc.
- The indicative retail meat prices are calculated by indexing forward actual average beef prices during each quarter, based on meat sub-group indices of the Consumer Price Index, provided by ABS. These indices are based on average retail prices of selected cuts (weighted by expenditure) in state capitals.
The producer share is calculated by dividing the estimated retail weight equivalent livestock price by the indicative retail price.
Click the links below to read earlier reports in this series:
March quarter 2024
Should cattle producers be paying more attention to retail margin share?